Using the Search Console API to Monitor Indexing at Scale

Search console api indexing at scale means replacing manual URL lookups with scheduled queries that record index states for hundreds or thousands of pages. The API exposes the same coverage concepts you see in Search Console, plus inspection detail for individual URLs, in a form that scripts can collect, store, and chart over time. This guide is for SEOs who are comfortable with sheets and scripts and for developers who will productionize the jobs, covering authentication, quotas, batching, storage, and dashboards without assuming deep infrastructure.
You will learn which endpoints and reports answer which questions, how to authenticate safely, how to design rotating batches that respect limits, how to store snapshots for trend analysis, and how to turn those snapshots into alerts and KPI reports. You will also learn common failure modes, from property mismatches to quota exhaustion, and how to keep data comparable across weeks and site changes. The approach respects IndexNow truth boundaries: IndexNow signals help participating engines, while Google monitoring still depends on Search Console data rather than IndexNow responses.
Key takeaways
- Use property level aggregates for trends, inspection detail for Tier 1 and triage, and sitemap reports for section views to stay within quotas.
- Authenticate with least privilege, store secrets outside code, and verify property host and protocol before scheduling jobs.
- Store narrow dated snapshots with consecutive state counters so trends, alerts, and audits share one history.
- Batch deterministically, log quota and runtime per run, and show data freshness so dashboards stay trustworthy at scale.
- What search console api indexing can and cannot tell you
- Authentication and property setup without surprises
- Mapping questions to endpoints and reports
- Designing batches quotas and schedules
- Writing snapshots built for trends and alerts
- Joining sitemap crawl and log signals
- Handling errors retries and partial runs
- From API rows to dashboards and KPIs
- Python and Node patterns that stay maintainable
- Security logging and cost control
- Keeping scaled monitoring accurate over time
- FAQ
- Sources
- Further reading
 <!-- IMAGE-PROMPT cover: 1200x630, DependsIt brand, deep charcoal #121212 or clean white background, vibrant mint #22E3B0 accent glow, thin node-network line art, Clash Display style bold headings space on left, General Sans clean labels, subject: API pipeline from Search Console to database to dashboard charts, flat vector, high contrast, accessible, no photorealistic faces, no text smaller than 24px, no em dash in rendered text, export PNG then cwebp -q 82 to WEBP -->
What search console api indexing can and cannot tell you
The Search Console API exposes programmatic access to data that mirrors Search Console reports, with granularity and limits suited to automation rather than ad hoc browsing. At property level you can query performance, coverage style aggregates, and sitemap information that show trends across sections and time. At URL level the inspection style detail reports index state, canonical declarations, last crawl time, and mobile and structured data signals for specific pages. Together these let you answer whether a section is stable, which URLs changed state, and what reason the system recorded, without opening the UI for each page.
What the API cannot do is check unlimited URLs instantly or provide real time guarantees. Inspection detail is quota constrained and intended for focused checks rather than full site scans every hour. Coverage data has processing delays, so today often reflects recent days rather than this minute. States can also shift during recrawls, which means single point responses need snapshot history and persistence rules before they become alerts. Treat the API as a reliable scheduled record, not as a live probe. Daily or weekly snapshots with clear timestamps beat frequent hammering that exhausts quota and creates noisy series.
Another boundary is engine scope. Search Console describes Google behavior only. It says nothing about Bing, Yandex, or other IndexNow participants, and IndexNow responses say nothing about Google because Google does not support IndexNow. Scaled monitoring should keep these domains separate: Search Console jobs for Google coverage, IndexNow submission logs for delivery signals to participating engines, and sitemap plus log signals as shared context. Mixing them into one indexed flag hides meaningful differences, such as a URL accepted by IndexNow but still excluded in Google for duplication. Keep engine specific states in separate columns even when dashboards summarize them side by side.
Finally, the API reflects what the system recorded, not why content was judged as it was. A state such as crawled but not indexed tells you the fetch succeeded and the page was not kept, but the remedy still requires human judgment about duplication, thinness, canonical signals, and internal support. That is why snapshots should join API states with technical fields such as HTTP status, canonical target, robots flags, sitemap membership, and template version. The API provides the backbone of scaled monitoring, and those joins provide the context that turns rows into fixes. Later sections show how to store and join them without building heavy infrastructure too early. Readers following a search console api guide should treat programmatic gsc data as the system of record for trends, while reserving url inspection api calls for Tier 1 and triage where detail justifies quota cost.
Authentication and property setup without surprises
Authentication is the least visible part of scaled monitoring and the most common place for silent failures. Start by confirming the Search Console property that matches your canonical host, protocol, and domain scope. A domain property covers all subdomains and protocols, while URL prefix properties are narrower and can create gaps where tracked URLs appear missing but are reported elsewhere. Choose one canonical property for monitoring, document it, and ensure every tracked URL normalizes to that scope. Mismatched www, http, or trailing slash forms cause confusing misses that look like coverage loss.
For access, use a dedicated service account or OAuth client with the minimum role needed to read Search Console data for that property. Avoid personal accounts tied to one employee, because departures and password changes break jobs quietly. Store client secrets and refresh tokens in a secret manager or environment vault, never in code or sheets. Restrict who can view and rotate them, and record an owner and rotation date. Verify access by running a small read only query for one Tier 1 URL and one aggregate report before scheduling anything. That smoke test catches permission and property errors while the blast radius is tiny.
Handle consent, verification, and delegation explicitly. The property must remain verified, and delegated access must persist for the monitoring identity. If verification lapses through DNS or file removal, jobs should fail loudly rather than writing empty snapshots. Add a preflight check that confirms verification and permission on every run and aborts with a clear error when either fails. Log the identity used, the property queried, and the scopes granted, so audits can confirm least privilege without guessing. These checks take minutes to add and prevent the worst failure mode: a dashboard that looks stable because the job stopped collecting.
Document setup so handoffs do not break history. Record property type and URL, monitoring identity, secret location, rotation owner, quota project, schedule, batch definitions, and retention rules in one runbook page. Link that page from the dashboard footer and from alert templates. When credentials rotate, update the secret in one place and rerun the smoke test plus one full batch before resuming the schedule. Clean authentication hygiene keeps scaled monitoring boring in the best sense: it runs at the same time, writes comparable rows, and notifies only on real coverage changes or job failures.
Mapping questions to endpoints and reports
Different monitoring questions need different data shapes, and mapping them early prevents quota waste. For section health over time, use property level and sitemap level aggregates that show submitted versus indexed counts, plus performance trends that reveal demand side movement. These aggregates are cheap to collect daily and they surface clusters without per URL calls. For Tier 1 vigilance, use URL level inspection detail on a small set with full evidence fields. For triage, run inspection detail on flagged URLs only, then join with your own crawl and log fields. This tiered mapping keeps detail where it pays and aggregates everywhere else.
Sitemap reports deserve special attention because they align with how teams own content. Each sitemap file can represent a section, such as blog, products, locations, or docs, and its indexed count trend often moves before anyone notices single page drops. Track submitted count, indexed count, last read date, and file validity per sitemap on a daily or weekly schedule. A sudden divergence where submitted rises but indexed falls points to dilution, duplication, or feed errors. A file that stops updating points to generator or deploy issues. These signals are inexpensive and they make section ownership obvious in dashboards.
Performance data complements coverage by showing whether indexed pages still earn impressions and clicks. A page can remain indexed while losing visibility due to intent shifts, snippets, or competition, so coverage alone overstates health. Join a lightweight performance summary per section, such as impressions, clicks, and average position buckets, to the coverage trend on a weekly basis. When coverage holds but clicks fall, investigate relevance and presentation rather than indexing. When both fall together, prioritize coverage triage first because visibility cannot recover until pages are indexable and indexed.
Inspection detail should be reserved for decisions, not curiosity. Define exactly which tiers and triage states trigger a detail call, and log every call with reason so quota use stays explainable. For example, allow detail calls for all Tier 1 daily, for Tier 2 only when aggregates move or digests flag clusters, and for Tier 3 only during audits. Cache detail responses in the snapshots table with timestamps instead of requerying the same URL multiple times per day from different tools. This discipline stretches quotas across larger inventories and keeps the system predictable as the site grows. Teams that combine search console data api aggregates with gsc api url status checks for Tier 1 get both trends and evidence without overspending quota. That same pattern supports steady gsc api monitoring across weeks.
Designing batches quotas and schedules
Batches turn quota limits into a sustainable rhythm. Assign every tracked URL a stable batch key derived from a hash or from section plus index number, then schedule batches so Tier 1 runs daily and other tiers rotate across the week. A 5,000 URL inventory might run 200 Tier 1 URLs daily, 2,000 Tier 2 URLs in four rotating batches of 500, and sampled Tier 3 weekly, while aggregates refresh daily for all sections. Record batch identifier and scheduled date in each snapshot so gaps are explainable and reruns target the same set. Deterministic batching keeps history comparable even when individual runs fail and retry.
Estimate quota and runtime before expanding coverage. Measure average calls per URL, average seconds per call with polite delays, and daily quota consumed per tier during a pilot week. Project those numbers to the full inventory and add headroom for triage spikes and retries. If daily full coverage exceeds safe limits, narrow Tier 1, increase rotation length for Tier 2, or move more weight to aggregates and samples. Document the math in the runbook so future expansions start from measured baselines rather than optimism. Scaling decisions become calm tradeoffs between freshness and cost instead of emergency cutbacks after quota errors.
Schedule around site rhythms to avoid recording transient states as drops. Avoid collection during deploy windows, nightly feed rebuilds, CDN cache purges, and bulk import jobs. Run jobs at stable off peak times, then deliver digests shortly after with fresh timestamps. Show last successful run and next scheduled run on every dashboard and alert so readers know whether flat lines mean stability or stalled jobs. When a run fails, rerun the same batch rather than skipping it, and mark late snapshots clearly so trend charts do not imply false stability. Freshness labels build trust more than any single chart.
Coordinate with other tooling that hits the same endpoints or the site itself. Multiple scripts querying the same URLs, plus external rank trackers and aggressive crawlers, can compound load and exhaust quotas faster than any single job suggests. Keep one inventory and one schedule as the source of truth, and point ad hoc checks to cached snapshots first. For site crawling, scope monitoring fetches to inventory plus hubs with polite rates, and reuse results across weeks when pages have not changed. Respectful scheduling keeps monitoring from becoming a performance problem while preserving the history needed for alerts and audits.
 <!-- IMAGE-PROMPT diagram-01: 1600px max, DependsIt brand mint #22E3B0 on charcoal #121212 or white, node-network line art, Clash Display style headings, General Sans clean labels, subject: batch rotation calendar for API quota safe monitoring schedule, flat vector, accessible, no em dash -->
Writing snapshots built for trends and alerts
Snapshots are the contract between collection and everything downstream, so keep them narrow, stable, and timestamped. A good row contains check date in UTC, URL, canonical target, batch identifier, index state code, last crawl date, HTTP status, in sitemap flag, robots flag, template version, and consecutive same state count. Store states as short codes with a separate legend table that preserves exact API wording for triage. Append rows instead of overwriting, and never change field meanings without versioning the schema. Stable snapshots make week over week charts, alert persistence rules, and audit comparisons possible without rework.
Compute derived fields at write time to simplify queries. Consecutive same state count powers persistence rules without complex window functions in every dashboard. Days since first seen out and days since last indexed power exception age sorting. Section and tier labels power grouped charts and digests. Content hash of title plus canonical plus robots flags powers quick detection of template regressions. These derivations cost little during collection and save repeated logic in reporting. Keep raw evidence such as full headers or HTML out of the main table, linked by URL and date only when an incident needs depth.
Validate rows before they enter history. Reject batches where row counts differ sharply from expected sizes, where state codes fall outside the known vocabulary, where dates are out of order, or where a whole batch returns identical errors. Quarantine invalid batches for review instead of writing them as drops, because bad writes create false incidents that erode trust. Log validation results with each run, including success count, error count, quota used, and runtime. Validation plus logging turns collection from a script into a dependable pipeline that auditors and stakeholders can trust.
Design retention to match analysis needs without bloating storage. Keep detailed Tier 1 daily rows for at least a year to support postmortems and seasonal comparisons. Keep Tier 2 rotating rows for six to twelve months, then aggregate to weekly section rates. Keep Tier 3 samples as weekly section summaries after a few months. Archive retired URLs with full history rather than deleting them, because template investigations often need past examples. Document retention alongside schema so reports remain comparable and nobody mistakes aggregation for recovery.
Joining sitemap crawl and log signals
API states become far more useful when joined with sitemap, crawl, and log fields collected on compatible schedules. Sitemap joins confirm whether a flagged URL is still listed, whether its file is valid, and whether lastmod reflects real changes. A weekly fetch of each sitemap file plus a membership lookup is enough to catch drift where feed changes silently remove live pages. Crawl joins confirm fetch reality at alert time: status, canonical, robots, title presence, internal link count, and word count bucket. These fields often reveal the cause without additional tools, such as a theme update that added noindex or truncated content.
Log joins add crawler behavior that APIs do not show directly. Aggregate search bot hits per tracked URL to last visit date, visit count over 14 days, and error rate. A discovered state with no recent visits needs discovery help through hubs and sitemaps. A crawled but excluded state with frequent visits needs content or canonical work rather than more signaling. After fixes, rising visits confirm the signal was received before the state flips, which helps set expectations with stakeholders. Even basic weekly log summaries transform triage from guessing to reading one joined row.
Implement joins by URL and week in a single triage view. The view should show index state, canonical, HTTP status, robots, sitemap membership, last crawl, last bot visit, template version, and owner. Build it first as a joined sheet or simple query, even if some inputs start as manual exports. The value is the side by side comparison, not the automation depth. Once the view proves useful, automate one input at a time, starting with sitemaps because they are simple and often reveal fast wins. Each automation should preserve field names and timestamps so history stays consistent.
Keep join logic honest about timing differences. Sitemap fetches, site crawls, log summaries, and API snapshots run at different hours and reflect different delays. Record collection timestamps per source and display them in the triage view. Avoid joining a Monday API state with a Friday crawl and treating them as simultaneous. When sources disagree, trust fetch reality for technical flags and API states for index outcomes, then note the gap in the incident record. Timestamp transparency prevents misdiagnosis and teaches the team how each signal lags or leads during recoveries.
Handling errors retries and partial runs
Scaled jobs fail in predictable ways, so handle them with explicit policies rather than ad hoc reruns. Transient failures such as rate limiting, timeouts, and temporary auth hiccups deserve retries with exponential backoff and jitter, capped at a small number of attempts per URL or batch. Persistent failures such as invalid credentials, unverified property, or unknown state codes should abort the batch with a clear error and a job failure alert, not silent partial writes. Quota exhaustion should pause remaining batches with a scheduled resume rather than hammering endpoints. Write these rules once and apply them to every run.
Partial runs need careful marking so dashboards do not show false stability. If only two of four Tier 2 batches complete, the dashboard should show freshness per batch and gray out stale sections rather than extending old values forward as if they were fresh. Store run status per batch with success, partial, failed, and skipped states plus error summaries. Rerun failed batches with the same batch identifier and date label when possible, so history remains aligned. This discipline matters most during incidents, when incomplete data can mislead triage about scope.
Log everything needed for postmortems without storing secrets. Useful log fields are run identifier, start and end time, batch identifier, property queried, calls attempted, calls succeeded, quota used, top error codes, and validation outcome. Avoid logging tokens, full credentials, or personal data. Ship logs to the same place the team already watches for site jobs, and alert on job failure separately from index drops. A failed job that writes nothing should never look like a quiet healthy index. Freshness indicators on dashboards close this gap by making staleness visible to every reader.
Build runbooks for the errors you will actually see. Include steps for quota exceeded, invalid grant, property not verified, batch timeout, sitemap fetch failure, and schema validation rejection. Each entry should list symptoms, likely causes, first checks, owner, and safe resume procedure. Link the runbook from job alerts so on call responders act consistently. After each real failure, update the entry with what happened and what changed. Over a few quarters this living runbook turns fragile scripts into operations that survive staff changes and traffic spikes.
From API rows to dashboards and KPIs
Dashboards translate API rows into decisions with three views: trends, exceptions, and new page velocity. Trends show indexation rate over time by tier and section with absolute counts alongside rates, so small and large sections are not mistaken for each other. Exceptions list pages that should be indexed but are not, sorted by tier and days out with cause hints from joined fields. New page velocity shows median and 90th percentile time from publish to first indexed snapshot per week, which reveals whether discovery and quality keep pace with publishing. Together these answer whether health is stable, what needs action today, and whether new content slows down.
Annotate timelines with deploys, template changes, sitemap rebuilds, feed cycles, and migration dates. Many sudden moves become obvious once markers appear, which shortens triage and prevents repeated investigation of the same release. Group exception tables by cause and template with counts and examples rather than endless per URL rows. A grouped view that says 14 URLs on one template share a canonical issue leads to one fix instead of 14 tickets. Keep charts calm with weekly granularity for most content and daily detail only for Tier 1 during launches or recoveries. Clarity beats density when owners have minutes to review.
Feed the same snapshots into KPI reporting so dashboards and executive summaries reconcile. Define indexation rate as indexed divided by should be indexed, time to index from publish date to first indexed snapshot, drop count from persistence based incidents, and recovery time from alert to confirmed recovery with consecutive snapshots. Break each by section and tier to show where process is strong and where it lags. Honest definitions prevent gaming where single positive checks close incidents that reopen the next week. When KPIs share the snapshot source with alerts, stakeholders trust both layers without reconciling competing numbers. Jobs that automate gsc reports weekly keep gsc api indexing status visible to owners, while lightweight api index checks on flagged URLs confirm whether fixes have propagated before the next full batch.
Review dashboard usage quarterly and remove charts that never trigger decisions. If a view has not led to a fix or a resourcing choice in three months, replace it with a field that does. Track time to detect and time to recover as dashboard outcomes, not just display metrics. The goal is shorter outages and fewer repeats, and the dashboard should be judged on those results. Small simplifications often improve response more than new visualizations, because owners act faster when the path from signal to owner to fix is unmistakable.
Python and Node patterns that stay maintainable
Maintainable collection code favors clarity over cleverness. Structure jobs as small functions with single responsibilities: authenticate, load inventory batch, fetch states with polite delays, validate rows, write snapshots, and emit run summaries. Keep configuration such as property identifier, batch definitions, schedules, and thresholds in one config file rather than scattered constants. Separate secrets from config through environment variables or a vault. This layout lets new maintainers understand flow in one reading and change schedules without touching fetch logic.
In Python, standard HTTP clients with retry wrappers and explicit timeouts are enough for most inventories, plus a sheets or database writer that appends validated rows. In Node, async workers with concurrency limits and backoff achieve the same with readable control flow. Both stacks should share the same snapshot schema and validation rules so teams can switch languages without rebuilding history. Include copy friendly examples for auth, single URL inspection, and batch iteration in the runbook, but keep production jobs free of inline experiments. Examples teach, production code runs quietly on schedule.
Make jobs observable by default. Emit structured logs per run with batch identifier, counts, quota use, runtime, and validation outcome. Expose health endpoints or status files that dashboards read for freshness. Add dry run modes that load a batch and validate without writing, which makes threshold and schema changes safe to test. Version the schema and config, and record which version wrote each snapshot batch. These practices cost little and pay off during audits when someone asks why a series changed definition mid year.
Avoid common maintainability traps that create hidden fragility. Do not hardcode full canonical URLs for site links in code when relative paths and config suffice. Do not embed credentials, tokens, or personal API keys in scripts. Do not write prose with em dashes in logs or comments where checks forbids them; use commas or colons instead. Do not add non allowlisted external calls from jobs without review, since monitoring should depend on trusted Search Console and site sources. Clean, observable, least privilege jobs survive team changes and scale from hundreds to thousands of URLs without rewrites.
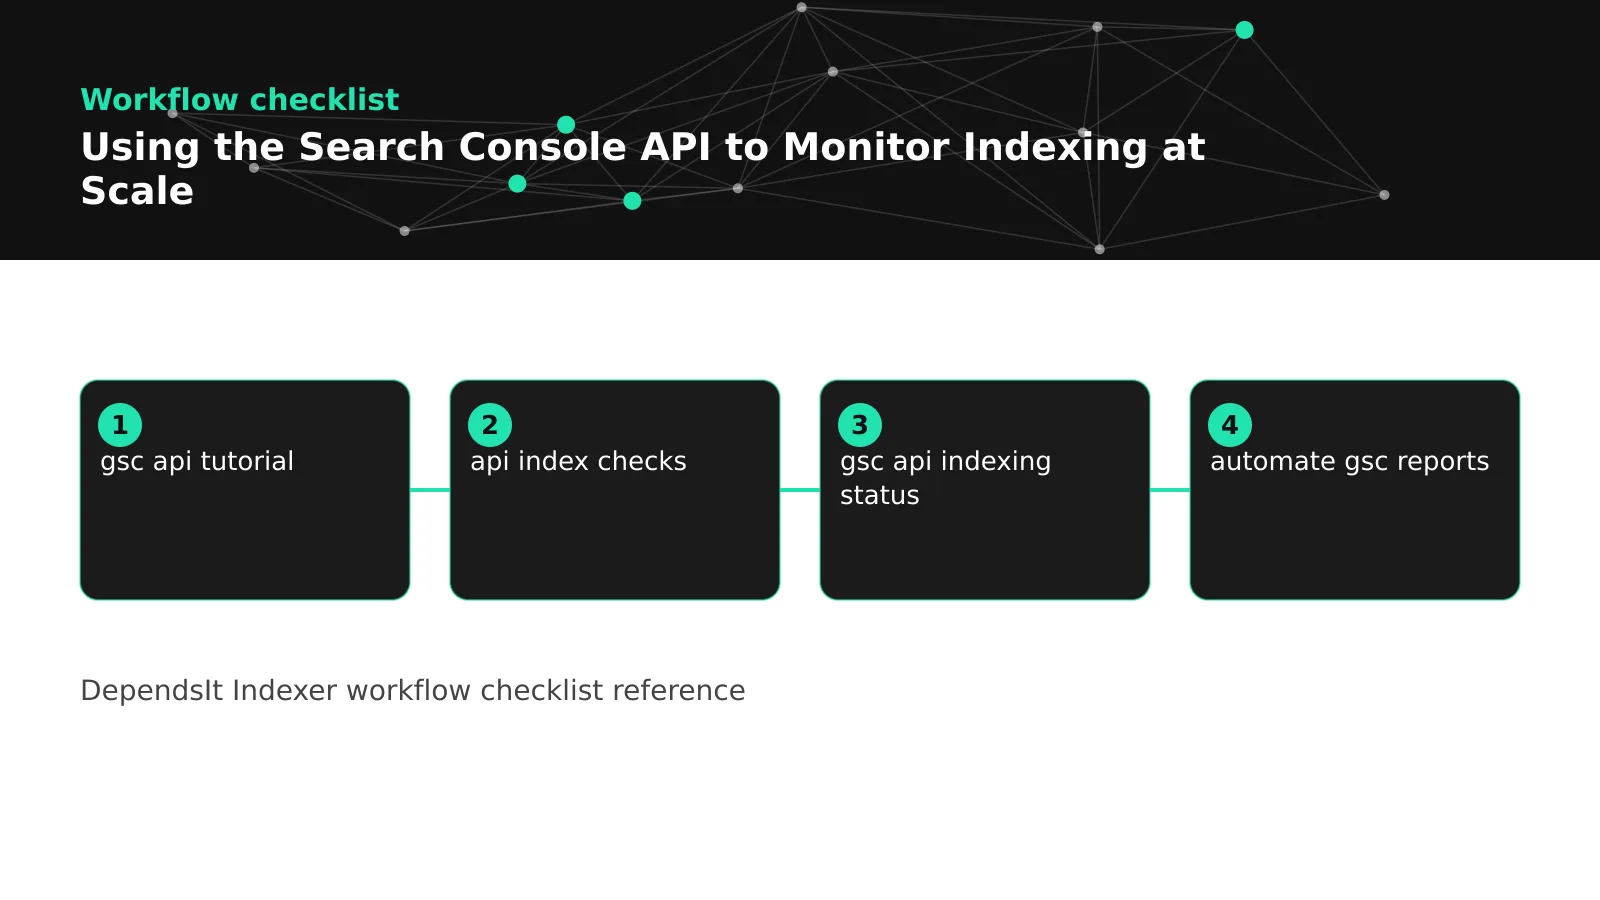 <!-- IMAGE-PROMPT workflow-02: 1600px max, DependsIt brand, deep charcoal #121212 background with vibrant mint #22E3B0 flow lines, thin node-network line art, Clash Display style headings, General Sans clean labels, subject: scaled API monitoring workflow from auth and batching to snapshots dashboards and alerts, flat vector, accessible, no em dash -->
Security logging and cost control
Scaled monitoring touches credentials, production data, and quotas, so treat it as production tooling with explicit controls. Apply least privilege to the monitoring identity, restrict secret access to owners and the job runtime, and rotate on a documented schedule or immediately after staff changes. Review access quarterly and remove stale identities. Log who changed config, thresholds, tiers, and schedules, because silent config edits can mimic coverage changes in trends. These controls keep history trustworthy and prevent well meaning tweaks from becoming untraceable drift.
Control costs in quota, runtime, and storage rather than assuming scale is free. Quota is the scarcest resource, so budget it by tier with headroom for triage spikes and document the math. Runtime costs grow with politeness delays and retries, so measure per batch and optimize batch sizes before adding parallelism. Storage grows with snapshot granularity, so apply retention rules that keep Tier 1 detail long and aggregate lower tiers over time. Review all three quarterly alongside precision metrics. When costs are explicit, expansions become planned tradeoffs rather than emergency cutbacks after failures.
Separate job failure alerts from coverage alerts in both routing and wording. A message that says monitoring job failed for batch B2 with quota exceeded and resume at 02:00 UTC should go to platform owners, while coverage drops go to content and SEO owners with cause context. Mixing them causes confusion where infrastructure pages get content fixes and coverage losses wait for platform triage. Keep runbooks linked from each alert type so responders follow the right path. Freshness indicators on dashboards reinforce the separation by showing whether flat lines reflect stability or stalled collection.
Audit security and cost controls as part of SEO audits, not just platform reviews. Confirm secrets are outside code, access is minimal and current, logs exclude sensitive values, and retention matches documentation. Confirm quota projects, batch schedules, and dashboard definitions align with the runbook. These checks take little time and they prevent the slow decay where jobs keep running but nobody can explain what they query or why. Trustworthy monitoring earns continued investment, and explicit controls are what make that trust defensible to stakeholders.
Keeping scaled monitoring accurate over time
Accuracy decays through inventory drift, schedule drift, and definition drift, so maintain all three on a cadence. Quarterly, review inventory for retired URLs, new sections, template renames, sitemap file changes, and tier accuracy after team or priority shifts. Verify property scope, credentials, quota allocations, and secret rotation. Review alert precision and dashboard usage, then adjust thresholds, batches, and views with recorded reasons. Short, regular maintenance beats heroic rebuilds and keeps history comparable across site changes.
Tie maintenance to change management for releases. Theme updates, plugin changes, CDN rules, feed rebuilds, and migrations can alter canonical logic, robots handling, sitemap output, or URL structure without notifying monitoring owners. Request that engineering and content flag relevant changes in a shared channel, annotate those dates on timelines, and run Tier 1 plus sitemap validation within 24 hours of major releases. Early verification catches accidental noindex, canonical rewrites, or feed regressions while rollback is still easy. This habit turns monitoring into a release safety net rather than a passive report.
Validate data quality on every run, not just during audits. Check batch sizes, state vocabularies, date order, and cross source timestamp alignment before writing. Quarantine invalid batches for review instead of recording them as drops. Display freshness prominently with last success and next scheduled run per batch. When freshness is visible, teams trust flat lines as stability and notice stalls immediately. Quality checks plus freshness labels are the cheapest way to keep scaled data believable.
Finally, connect scaled history to planning so its value compounds. Use past time to index by template to set realistic targets for new sections. Use incident clusters to prioritize template and infrastructure fixes with measured impact. Bring snapshot evidence to postmortems and audits instead of anecdotes. When monitoring informs resourcing and roadmaps, it keeps its quota and maintenance time. That support funds the next refinements, from tighter joins to wider Tier 1 during launches, which further shortens the gap between a coverage change and a confident fix.
FAQ
How many URLs can the Search Console API monitor in practice?
Practical scale depends on quotas, batching, and tiering rather than a fixed number. Small sites can track a few hundred URLs weekly with simple scripts. Larger inventories reach thousands by keeping Tier 1 daily, rotating Tier 2 across the week, and using aggregates plus samples for the rest. Reserve inspection detail for Tier 1 and triage, rely on sitemap and property aggregates for broad trends, and log quota per run. Measure pilot throughput, then project with headroom before expanding.
Should I use url inspection api detail for every URL every day?
No, because detail quotas and runtimes make daily full inventory checks impractical and noisy. Use detail for Tier 1 daily and for flagged URLs during triage, and use aggregates plus rotating batches for broader coverage. Cache responses with timestamps instead of requerying from multiple tools. This balance preserves evidence where it matters while keeping schedules sustainable and dashboards calm. This guidance is the core of any gsc api tutorial for large inventories, because it shows how to keep gsc api monitoring sustainable as URL counts grow.
How do I handle property mismatches that look like coverage loss?
Confirm the canonical property scope first, including domain versus prefix, www versus non www, and http versus https. Normalize tracked URLs to that scope, deduplicate to canonical targets, and verify the property remains verified for the monitoring identity. Add a preflight check that aborts loudly on verification or permission failure rather than writing empty snapshots. Document the property choice in the runbook so handoffs do not reintroduce mismatches.
What is the best storage shape for API snapshots?
Use two narrow tables: inventory with one row per canonical URL and snapshots with one row per URL per check date. Include check date in UTC, index state code, canonical target, HTTP status, sitemap flag, robots flag, template version, batch identifier, and consecutive state count. Append rather than overwrite, validate vocabularies and batch sizes on write, and retain Tier 1 detail longer while aggregating lower tiers over time. Stable narrow rows support trends, alerts, and audits from one history.
How do API snapshots relate to IndexNow submission logs?
Keep them separate by engine. API snapshots record Google coverage from Search Console. IndexNow logs record delivery signals to participating engines, which do not include Google. Join them by URL and week for a complete operations view, but never treat IndexNow acceptance as proof of Google indexing. Separate columns prevent honest delivery signals from masking real coverage gaps.
When should scaled monitoring move from sheets to a database?
Move when inventory exceeds a few hundred URLs, when rotating batches and joins become painful, or when multiple people need concurrent access with audit trails. Sheets work well for pilots and Tier 1, but databases handle narrow snapshot tables, indexes by URL and date, retention rules, and dashboard queries more reliably at scale. Migrate the same schema and validation rules rather than redesigning, and keep dashboard definitions stable so trends remain comparable.
Sources
- IndexNow protocol documentation
- Google Search Console index coverage help
- https://www.indexnow.org/documentation
- https://support.google.com/webmasters/answer/7440203