The KPIs That Matter for Indexing (And How to Report Them)

The KPIs that matter for indexing show whether important pages enter the index quickly, stay there reliably, and recover fast after drops. Many reports stop at indexed or not for a handful of URLs, which hides trends, clusters, and business impact. This guide defines a small set of indexing KPIs that work for small sites and scale to large catalogs, plus reporting habits that keep stakeholders aligned without overwhelming detail. It is written for SEOs, content owners, and developers who need shared numbers for planning, triage, and audits.
You will learn how to define indexation rate, time to index, drop and recovery metrics, and exception age, how to segment them by section and tier, how to set targets from history, and how to present them in weekly and monthly rhythms. You will also learn what to leave out, how to annotate releases and feed changes, and how to connect KPI movements to monitoring snapshots and audit actions. The data backbone is Search Console coverage joined with sitemap, crawl, and log signals, with IndexNow delivery tracked separately for participating engines since Google does not support IndexNow.
Key takeaways
- Report indexation rate, time to index, drop count, recovery time, and exception age by section and tier instead of single page yes or no checks.
- Define each KPI with numerator, denominator, persistence rules, and timestamps so dashboards, digests, and executive summaries reconcile.
- Set targets from 90 days of history per section, annotate releases and feed changes, and review precision monthly.
- Link every KPI movement to snapshots and owners so reports lead to fixes rather than passive observation.
- Why single page indexed checks mislead stakeholders
- Indexation rate the core health metric
- Time to index measuring velocity for new content
- Drop count and recovery time proving responsiveness
- Exception age and backlog showing current risk
- Segmenting by section template and tier
- Setting targets for indexing kpis from history not guesses
- Weekly monthly and quarterly reporting rhythms
- Visuals and annotations that prevent misreads
- What to exclude to keep reports honest
- From KPIs to audits and roadmaps
- FAQ
- Sources
- Further reading
 <!-- IMAGE-PROMPT cover: 1200x630, DependsIt brand, deep charcoal #121212 or clean white background, vibrant mint #22E3B0 accent glow, thin node-network line art, Clash Display style bold headings space on left, General Sans clean labels, subject: KPI dashboard with indexation rate gauges and time to index bars, flat vector, high contrast, accessible, no photorealistic faces, no text smaller than 24px, no em dash in rendered text, export PNG then cwebp -q 82 to WEBP -->
Why single page indexed checks mislead stakeholders
Single page checks answer whether one URL appears indexed today, but they cannot show whether the site is healthy, improving, or at risk. A homepage that is indexed says nothing about 400 new products waiting in discovered states. A money page that flickers during a recrawl looks like failure in isolation but reads as normal variance inside a stable trend. Stakeholders who see only spot checks swing between false comfort and false alarm, because they lack denominators, history, and segmentation. KPIs fix this by placing each page inside a defined set with dates, so movements mean the same thing every week.
Spot checks also hide clusters that determine business impact. Five drops on one template matter more than five scattered drops across unrelated archives, yet single lookups treat them identically. Without section and template segmentation, reports cannot route work to the right owner or estimate recovery scope. Teams debate anecdotes while the shared cause persists. A KPI set built on snapshots groups changes automatically, shows which sections moved together, and links to example URLs with cause hints. That structure turns discussion from opinions about single pages into decisions about templates, feeds, and infrastructure.
Another problem is timing without persistence. Indexes update on crawler schedules, not clocks, so states can flicker as pages are refetched and reevaluated. A report that counts every flicker as a drop creates noise that teaches stakeholders to ignore coverage entirely. A report that requires persistence, such as two consecutive non indexed snapshots before counting an incident, reflects operational reality where transient recrawls resolve without action. Documenting persistence inside KPI definitions keeps weekly numbers comparable and prevents gaming where single positive checks close incidents that reopen days later.
Finally, spot checks rarely connect to business value. Stakeholders care about revenue pages staying visible, new content starting to earn traffic on schedule, and recovery speed after incidents. KPIs should mirror those concerns with tiered rates, velocity percentiles, and recovery times rather than raw totals that mix money pages with archives. When reports speak in those terms, resourcing follows: template fixes get prioritized because they move a section rate by points, and feed validation gets funded because it shortens time to index for every launch. The next sections define each KPI precisely so teams can adopt them without reinventing logic.
Indexation rate the core health metric
Indexation rate is the share of URLs that should be indexed and currently are, calculated as indexed divided by should be indexed for a defined set and date. The denominator is the critical choice. It must include only canonical, live, indexable URLs that the business wants in the index, grouped by section and tier. Exclude noindex pages, redirects, retired products, staging hosts, parameter duplicates, and other variants that should consolidate. A clean denominator makes the rate a management signal. A dirty denominator makes it permanent noise that everyone learns to ignore.
Calculate the rate from snapshots rather than live lookups so history is consistent. Each snapshot records index state per URL with a date, and the rate for that date is the indexed count over the eligible count. Track it weekly for most sections and daily for Tier 1 during launches or recoveries. Show absolute counts alongside percentages, because 95 percent on 40 URLs and 95 percent on 4,000 URLs imply different risk and different work. Break the rate by tier first, then by section, so executives see overall health while owners see where to act. Preserve exact state strings underneath the rate for triage, because discovered versus crawled exclusions point to different fixes.
Interpret movement with context, not thresholds alone. A two point dip after a large product import may reflect normal lag while new URLs await crawling, especially if time to index holds steady and exception age stays young. A two point dip concentrated on one template with rising exception age points to a regression that needs a fix. Annotate deploys, feed rebuilds, sitemap changes, and migration dates on the trend line so readers connect movement to causes without extra meetings. Review 90 days of history to learn each section baseline, because a stable 98 percent guides section and a volatile 84 percent catalog need different sensitivity.
Report indexation rate with freshness and definition footers on every chart. State snapshot date in UTC, batch coverage, denominator rules, and persistence logic in one line so numbers reconcile across dashboards, digests, and slides. Link each chart to the underlying snapshot view with example URLs for the current exceptions. When definitions are visible, debates shift from what the number means to what to do about it. That shift is the difference between reporting as theater and reporting as control, and it is why indexation rate belongs at the top of every indexing KPI set.
Time to index measuring velocity for new content
Time to index measures days from publish date to first indexed snapshot for new URLs, summarized as median and 90th percentile per week or month. Median shows typical velocity that planning can rely on. The 90th percentile shows tail risk where a meaningful share of pages lag and need attention. Together they reveal whether discovery and quality keep pace with publishing better than any single anecdote about one fast or slow page. New launches, migrations, and seasonal pushes should be judged on these percentiles rather than on immediate spot checks that catch pages mid crawl.
Build the metric from reliable dates. Publish date should come from the CMS as first live date, not last updated date that rewrites history on every edit. First indexed date should come from snapshots with consistent cadence, acknowledging that weekly snapshots quantize results to week boundaries. For example, a page published Monday and first seen indexed the next Monday has a time to index of up to seven days given weekly snapshots, even if the engine indexed it midweek. Keep cadence stable so week over week comparisons remain valid, and note cadence in the definition footer. For Tier 1 launches where days matter, use daily snapshots temporarily to get tighter estimates, then return to weekly for steady state.
Segment velocity by section and template because averages hide operational differences. Guides with strong hubs may index in days while deep product variants take weeks without feed and link support. Location pages may cluster by market based on internal linking depth. Reporting these segments guides specific fixes: hub placement and sitemap freshness for slow discovery, canonical consolidation for duplicate heavy tails, and content strengthening for post crawl delays. Track publish volume alongside velocity, because a stable median during doubled output reflects real capacity while a rising 90th percentile during normal output signals emerging constraints.
Use velocity to set expectations and to validate fixes. Before a launch, cite the last 90 days of median and 90th percentile for similar templates as the forecast range. After strengthening hubs or fixing sitemap drift, watch the next two cohorts for percentile improvement rather than declaring victory from one fast page. If velocity degrades while indexation rate holds, investigate crawl prioritization, internal link depth, and feed competition before assuming quality issues. Velocity is an early warning for scaling limits, and teams that watch it adjust publishing pace, linking, and sitemap strategy before backlogs become drops. Teams that track the time to index kpi alongside the basic index kpi can measure indexing success with more precision across templates.
Drop count and recovery time proving responsiveness
Drop count and recovery time show whether the team catches and fixes losses quickly. Define a drop as a persistence confirmed move from indexed to excluded for a URL that should remain indexed, using rules such as two consecutive non indexed snapshots for Tier 2 and immediate confirmation for Tier 1. Count one incident per cause cluster rather than one per URL when siblings share a template and date, so metrics reflect operational load instead of inflated page counts. Recovery requires two consecutive indexed snapshots after a verified fix, not a single positive check during recrawling. These definitions keep counts honest and comparable across weeks.
Recovery time runs from alert delivery to confirmed recovery, with detection time from first changed snapshot to alert as a useful sub metric. Break both by tier and cause because technical errors, canonical issues, and thin content recover on different timelines. Stray noindex or server errors often resolve in days once fetches succeed. Canonical and duplication clusters take weeks as signals reprocess. Thin content improvements take longest because reevaluation depends on quality beyond crawling. Reporting these splits sets realistic expectations with stakeholders and guides resourcing toward fixes with the best time adjusted impact.
Present drops and recoveries as a small operations summary alongside health trends. Useful weekly figures are new incidents opened, incidents closed with confirmed recovery, median detection time, median recovery time by tier, and incidents past their recheck date. Link each figure to the incident list with cause, owner, and snapshot evidence. This summary proves responsiveness without dramatizing every flicker, because persistence rules already filtered transients. Over quarters, falling detection time shows monitoring maturity, falling recovery time shows triage effectiveness, and falling repeat cause share shows systemic fixes working.
Guard these metrics against gaming with explicit audit rules. Do not allow closing on single checks, do not merge unrelated pages into clusters to lower counts, and do not reset clocks by editing inventory instead of fixing causes. Review a sample of closed incidents monthly for evidence links and consecutive snapshots. When metrics are auditable, they sustain trust during difficult quarters where drops rise due to migrations or assortment churn. Stakeholders accept higher counts when they see fast detection, clear causes, and confirmed recoveries tied to systemic improvements.
 <!-- IMAGE-PROMPT diagram-01: 1600px max, DependsIt brand mint #22E3B0 on charcoal #121212 or white, node-network line art, Clash Display style headings, General Sans clean labels, subject: KPI trend charts showing indexation rate time to index and recovery timelines, flat vector, accessible, no em dash -->
Exception age and backlog showing current risk
Exception age measures how long each should be indexed URL has remained out, calculated from first non indexed snapshot in the current spell to today. Backlog is the set of current exceptions grouped by section, cause, and age buckets such as 0 to 7 days, 8 to 21 days, 22 to 45 days, and over 45 days. While rates show proportions and drops show flow, age shows risk sitting in the queue today. A stable rate with aging backlog means old problems persist while new pages mask them. A falling rate with young backlog means a fresh incident needs triage. Both views are needed to prioritize correctly.
Sort daily work by tier first, then by age and cause cluster size. A Tier 1 page out for three days outranks a Tier 3 sample out for a month. A cluster of 12 young product pages on one template outranks scattered old long tail pages with thin content. This ordering focuses effort where recovery moves business metrics fastest and where one fix clears many rows. Show oldest exception per section in section tables so owners feel accountability for stale items without drowning in per URL lists. Age makes neglect visible in a way that rates alone cannot.
Use age buckets to set service expectations by tier. For example, Tier 1 exceptions should clear or escalate within 7 days, Tier 2 clusters within 21 days, and Tier 3 trends should improve quarter over quarter rather than promising per URL dates. Track share past expectation as a backlog health KPI alongside median age. When past expectation share rises, freeze new scope and swarm the oldest clusters with template or infrastructure fixes instead of opening more page level tickets. Backlog discipline prevents the common failure where new incidents get attention while old ones quietly become permanent exclusions.
Link every aged exception to its history and likely cause so age leads to action. The backlog view should show URL, section, template, tier, owner, current state, consecutive count, canonical, sitemap flag, last crawl, and template version in one row with links to snapshots and triage checklists. Without this join, age reports create guilt without guidance. With it, owners see whether an old item needs content consolidation, canonical cleanup, or simply archival because the page should no longer be indexed. Regular backlog grooming with these fields keeps the denominator clean and the remaining age truthful.
Segmenting by section template and tier
Segmentation turns sitewide averages into owned decisions. Segment first by tier to reflect business value, then by section to reflect ownership, then by template to reflect shared causes. A publisher might use news, guides, reviews, and author archives. A store might use categories, brands, products, and blog. A directory might use locations, categories, and detail pages. Each segment reports tracked count, indexed count, rate, week over week change, median time to index for new pages, open incidents, and oldest exception age. This compact table lets executives scan health while owners find their next fix.
Template segmentation deserves emphasis because it reveals fix leverage. When 30 variants on one template share a canonical issue, the section rate dip looks modest but the fix clears many pages at once. Tag each URL with template name and version from the CMS or crawl, and preserve version history across releases. Dashboards that group exceptions by template version with counts and examples guide one template change instead of scattered page edits. Postmortems that cite template versions with dates get platform work prioritized faster than general notes about duplication or thinness.
Keep segment definitions stable across quarters so trends mean the same thing over time. Record what belongs in each section, how tiers map to value, and how templates are named, in one definitions page linked from every report. When the site reorganizes, version the segments and restate history rather than silently rewriting it. Stable definitions make targets meaningful and audits comparable. They also prevent accidental improvements where moving weak pages to an untracked segment lifts a rate without fixing anything. Honest segmentation is a prerequisite for honest KPIs.
Balance granularity against readability by showing two levels by default and drilling on demand. The default monthly report might show tier plus section, with template breakdowns linked for sections that moved. The weekly operations view might show section plus template clusters for open incidents only. Avoid dumping every URL into executive reports. Link to snapshot views for detail instead. Segmentation should answer who owns the movement and what shared cause likely explains it, with evidence one click away for those who need depth. A clear index coverage kpi per segment helps teams review indexing metrics seo without losing the section context.
Setting targets for indexing kpis from history not guesses
Targets work when they reflect what similar pages actually achieved, not aspirational round numbers. For each section and tier, use the last 90 days of snapshots to set a baseline rate, a median and 90th percentile time to index, and typical drop and recovery ranges. Set the target as a narrow band around proven performance, such as baseline plus one to two points for rate or 10 percent improvement in median velocity for a quarter with specific hub and sitemap work planned. Bands acknowledge variance from recrawls and publishing bursts better than single point goals that fail on noise.
Adjust targets for known context rather than applying one sitewide number. New sections start lower and ramp over 60 to 90 days as discovery and quality signals accumulate. Seasonal catalogs swing with assortment churn and need volume adjusted expectations. Thin archives undergoing consolidation may dip before improving as weak variants leave the denominator intentionally. Document these contexts alongside targets so misses trigger diagnosis instead of blame. A target with a written context note guides action, while a bare number invites gaming such as narrowing denominators to hit percentages without improving visibility.
Review targets quarterly with the same history used to set them. If a section beats its band for two consecutive quarters due to durable fixes, raise the band and record why. If it misses due to a migration or feed regression with a known fix date, hold the band and track recovery milestones instead of lowering the bar permanently. Show target bands directly on trend charts with annotations for releases and fixes, so readers see whether movement reflects progress or variance. Targets become planning tools when they carry history and annotations rather than floating as isolated goals.
Involve owners in target setting so commitments feel achievable. Ask section owners what template or linking work they will ship, what publish volume they expect, and which denominator cleanups they will complete. Translate those commitments into rate and velocity implications using past incident sizes and cohort performance. When owners co author targets, they defend denominators, maintain tiers, and fix causes instead of disputing numbers. That participation sustains KPI quality more than any single statistical method.
Weekly monthly and quarterly reporting rhythms
Different rhythms serve different decisions, so separate them explicitly. Weekly operations reports focus on what changed and what needs action: rate deltas by section, new incidents grouped by cause, recoveries confirmed, backlog age movement, and Tier 1 status. Keep them to one page with links to snapshots and incident records. The audience is owners and specialists who will triage this week. Clarity and brevity matter more than completeness, because the goal is faster fixes rather than comprehensive archives.
Monthly stakeholder reports translate operations into business language: indexation rate trends by tier and section, velocity percentiles for new cohorts, drop and recovery summaries with cause splits, backlog age health, and systemic fixes shipped with measured impact. Add absolute counts beside rates, annotate releases and feed changes, and show targets as bands rather than single lines. The audience includes marketing and product leaders who allocate resources. The report should justify one or two investment choices, such as template consolidation or feed validation, with evidence from snapshots and incidents rather than listing every fluctuation.
Quarterly reviews connect KPIs to roadmaps and audits. Summarize precision of alerts, threshold changes, segment definition updates, and denominator cleanups that affect comparability. Present top repeating causes with incident counts, snapshot evidence, and proposed platform fixes with expected point lifts based on prior scope. Review retention, quota, and tooling costs alongside outcomes to keep monitoring funded appropriately. The audience is leadership deciding where to invest. The message should be control and compounding improvement: faster detection, faster recovery, fewer repeats, and current risk expressed as aged backlog by section.
Keep all three rhythms on the same definitions and snapshots so numbers reconcile. Use identical numerators, denominators, persistence rules, and timestamps across chat alerts, dashboards, slides, and docs. Publish definitions with each report and link to the snapshot views that back the figures. When someone questions a number, the path from chart to URL history should take seconds. Reconciliation builds trust faster than polished visuals, and it lets teams spend meetings on fixes and roadmaps instead of arguing about arithmetic.
Visuals and annotations that prevent misreads
Good visuals show trends, scale, and context without inviting false conclusions. Use line charts for rates and velocity over time with one line per tier or section, never one line per URL. Show absolute counts in tooltips or companion tables so small and large sections are not confused. Use grouped bars for drop causes and age buckets so clusters stand out. Keep color use calm with one accent for alerts and one for targets, following an accessible palette with sufficient contrast. The goal is a five minute read for owners and a drill path for specialists, not visual density for its own sake.
Annotations do more work than additional charts. Mark deploys, template version changes, sitemap rebuilds, feed cycles, migration steps, and known platform delays directly on timelines. Many sudden moves become self explanatory once markers appear, which shortens triage and prevents repeated investigation of the same release. Require that every manual annotation carry a date in UTC, an owner, and a link to the change record. Automatic annotations from deploy pipelines and feed jobs are even better because they stay complete during busy periods when manual notes are forgotten.
Design tables for action with grouped rows, counts, and examples. An exceptions table that lists 200 identical rows buries other problems and discourages review. A grouped table that shows cause, template, count, oldest age, owner, and three example URLs with links leads to one fix per row. Sort by tier then age then cluster size to surface business risk first. Include data freshness with last successful run and next scheduled run on every view so flat lines read as stability rather than stalled jobs. Actionable tables get opened weekly. Exhaustive dumps get ignored.
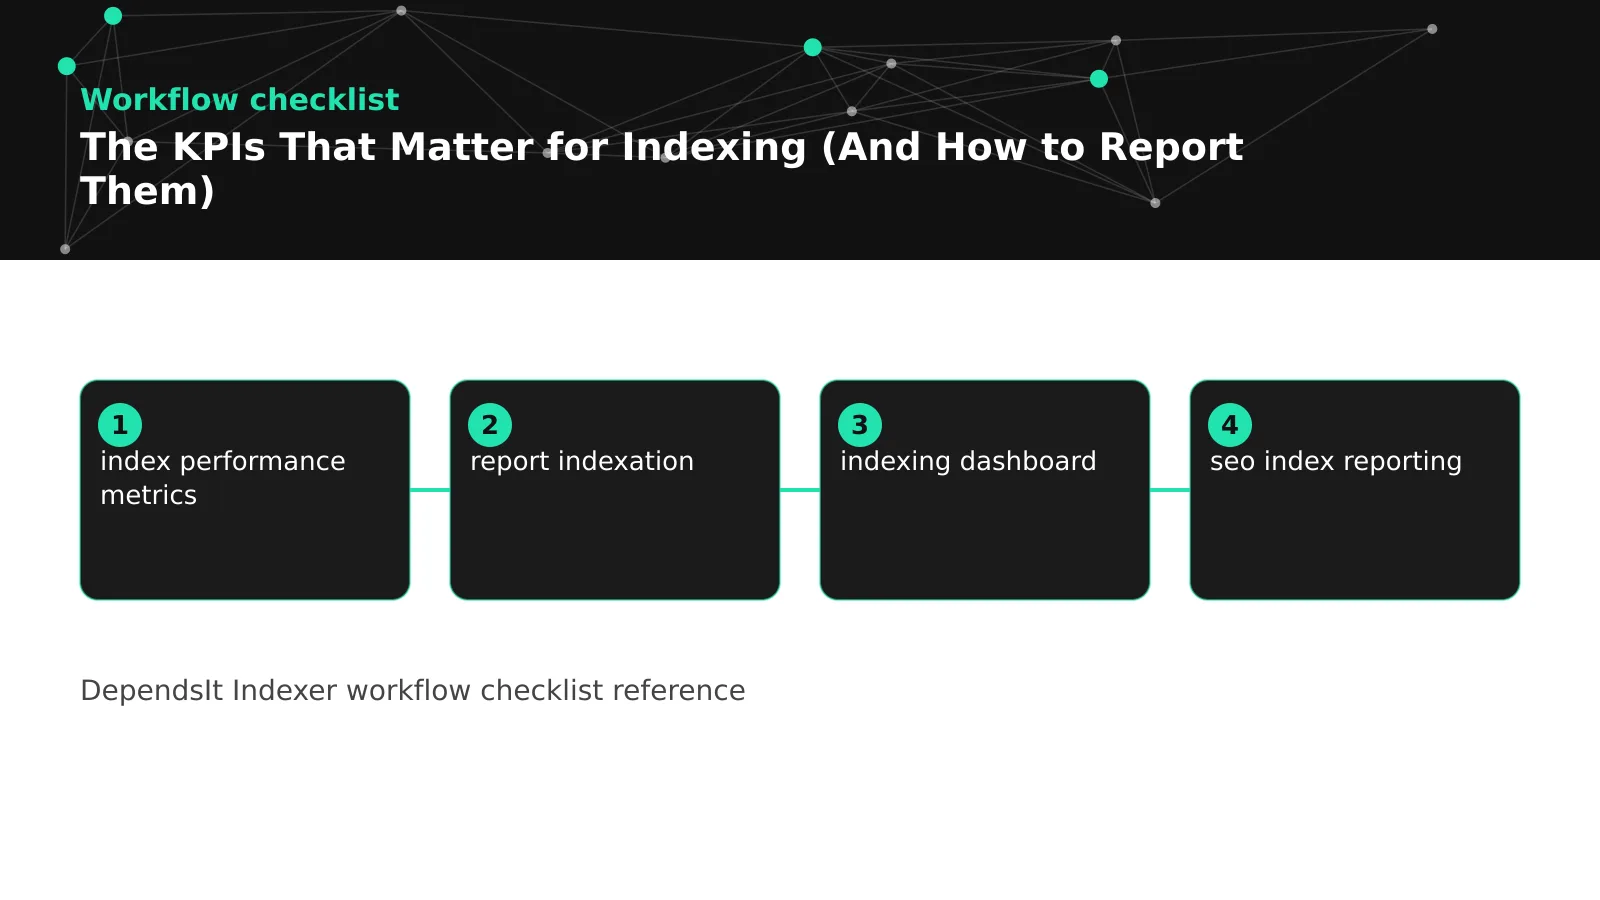
Test visuals with their actual readers quarterly. Ask owners whether they can name their section health, next fix, and oldest risk within minutes. Ask stakeholders whether they can state targets and current gaps without help. Remove or simplify views that never trigger decisions, and promote fields that do. Small edits such as renaming a vague metric, adding absolute counts, or clarifying a denominator often improve decisions more than new charts. Visuals earn their place by shortening time to action, and regular reader feedback is how they stay honest. Keep one indexing dashboard as the shared view for seo index reporting so weekly and monthly numbers stay consistent.
 <!-- IMAGE-PROMPT workflow-02: 1600px max, DependsIt brand, deep charcoal #121212 background with vibrant mint #22E3B0 flow lines, thin node-network line art, Clash Display style headings, General Sans clean labels, subject: reporting cadence workflow from snapshots to weekly monthly quarterly reports, flat vector, accessible, no em dash -->
What to exclude to keep reports honest
Exclusions protect KPI integrity by keeping denominators focused on URLs that should be indexed. Exclude staging and preview hosts entirely, internal search results, faceted and parameter duplicates that canonicalize elsewhere, noindex utility pages, redirect sources, retired products past their removal date, and thin placeholders that do not meet the content bar. Each excluded class should have an explicit rule and a separate verification where needed, such as confirming noindex pages stay out. When exclusions are explicit, rates reflect management quality rather than inventory sprawl.
Handle transitions cleanly so reports do not swing on bookkeeping. When pages consolidate, move retired URLs to archived history with dates instead of letting them fail in the active set. When sections reorganize, version segment definitions and restate history rather than rewriting it silently. When denominators are cleaned, annotate the date and show before and after counts so readers understand step changes. These practices prevent false improvements where narrowing the set lifts a rate without fixing visibility, and they keep audits comparable across quarters.
Resist vanity totals that mix indexable and non indexable URLs into one big indexed count. Totals without denominators hide section failures behind large stable archives. Totals that include variants double count the same intent and overstate reach. Report totals only alongside tiered rates with clear denominators, or omit them from executive views entirely. Honest KPIs sometimes look smaller than vanity totals, but they guide fixes that grow durable visibility instead of comforting stakeholders while money pages stay out.
Document exclusions alongside definitions and review them quarterly. Ask whether each excluded class still belongs outside the denominator and whether new patterns, such as a new facet or feed variant, need rules. Check that exclusion logic in code matches documentation, because drift between them creates silent denominator changes that move rates without real improvement. Explicit, reviewed exclusions keep reports defensible when leadership asks hard questions during flat or down quarters.
From KPIs to audits and roadmaps
KPIs become roadmaps when repeating patterns point to platform work with measured impact. Aggregate incidents by cause and template each quarter to find the fixes that would move section rates most. For example, 14 canonical incidents on one template with dates and snapshot evidence justify consolidation work with an expected point lift based on prior scope. Sitemap drift incidents with feed dates justify validation and ownership with velocity gains for every launch. Thin content clusters justify consolidation and rewriting withLinks to example recoveries. Quantified patterns get funded faster than general best practice requests.
Bring KPI evidence to audits instead of anecdotes. An audit that cites rate trends, velocity percentiles, drop counts, recovery times, and aged backlog by section can prioritize template, infrastructure, and content work with clarity. Preserve snapshot history for retired URLs and templates so postmortems compare current failures with past ones on similar structures. Recommend systemic fixes with owners, dates, and expected KPI movement, then track those movements in monthly reports to close the loop. This evidence chain turns audits from one time documents into operating plans with verifiable outcomes.
Use KPIs to plan publishing and migrations safely. Forecast new section performance from similar template history, schedule Tier 1 daily snapshots during cutovers, and define rollback criteria tied to rate bands and exception age rather than gut feel. During migrations, replace per URL alert noise with a dedicated watch view that tracks progress against targets with annotations for each migration step. After cutover, hold elevated monitoring until rates and velocity stabilize for two consecutive cycles. Planned vigilance prevents the silent losses that otherwise surface weeks after launch.
Close the loop visibly so investment continues. Each quarter, summarize KPI movement, systemic fixes shipped, detection and recovery time changes, top causes addressed, and current backlog risk by section with links to dashboards and incident records. Show how monitoring, alerts, and audits shared the same snapshots and definitions to produce those results. When leadership sees faster recovery, fewer repeats, and predictable launches, KPI work keeps its quota, storage, and maintenance time. That support funds tighter joins, better annotations, and wider Tier 1 coverage, which further shortens the distance between a coverage change and a confident, reported fix.
FAQ
What are the essential indexing KPIs for a small site?
Track indexation rate for priority URLs, median time to index for new pages, open exceptions with age, and monthly drop and recovery counts. Segment by section even when small, show absolute counts beside rates, and annotate releases. These four views reveal health, velocity, current risk, and responsiveness without heavy tooling. Expand to percentiles, cause splits, and template breakdowns only after the basics drive regular fixes. This compact set works well as starter index performance metrics before you add advanced views.
How is indexation rate calculated without gaming?
Divide indexed URLs by should be indexed URLs for a defined set and date, where the denominator includes only canonical, live, indexable pages the business wants in results. Exclude noindex, redirects, retired, staging, and duplicate variants with explicit rules. Calculate from dated snapshots with persistence logic, version segment definitions, and annotate denominator cleanups. Auditable denominators keep rates honest across quarters.
What time to index target should new content aim for?
Set targets from your own 90 day history per template rather than generic benchmarks. Use median for planning and 90th percentile for risk, noting snapshot cadence in the definition. New sections ramp over 60 to 90 days. If velocity degrades while rates hold, check discovery depth, hub links, and sitemap freshness before assuming quality issues. Forecast launches from similar template cohorts and validate fixes across two cohorts before declaring improvement.
How should indexing KPIs be presented to non technical stakeholders?
Lead with tiered rate trends, velocity percentiles, and recovery summaries in business language, with absolute counts and target bands on every chart. Annotate releases and feed changes, group exceptions by cause with owners, and link to snapshot evidence for detail. Close with one or two resourcing choices tied to measured impact. Keep weekly detail in operations views and monthly summaries focused on decisions and outcomes.
Do IndexNow metrics belong in Google indexing KPI reports?
No, keep them separate by engine because Google does not support IndexNow. Report IndexNow submissions and responses as delivery signals for participating engines, and report Search Console based rates, velocity, and recovery for Google. Join by URL and week for operations context, but never blend acceptance into Google rates. Separate columns keep reports honest across engines.
How often should KPI definitions and targets be reviewed?
Review precision and usefulness monthly with a light check, and run a full quarterly review of definitions, segments, denominators, targets, and retention. Version any change with reason and date, restate history where segments changed, and simulate threshold effects against recent data. Regular review keeps numbers comparable, trusted, and tied to current site structure and priorities.
Sources
- IndexNow protocol documentation
- Google Search Console index coverage help
- https://www.indexnow.org/documentation
- https://support.google.com/webmasters/answer/7440203