Tools to Monitor Google Index Status at Scale

Checking ten URLs by hand is easy. Checking ten thousand URLs by hand is impossible. Manual inspection breaks down once catalogs, marketplaces, publishers, and multi region sites need daily answers about what is indexed, what dropped, and what never entered the index. This guide is for SEO leads, developers, and content operations teams who need index status monitoring that scales. You will learn why manual checks fail, how to use Search Console data and APIs for bulk views, how to combine logs and exports for proof, how to set alerts without noise, and how to pick a stack for 100, 1,000, and 100,000 URLs. The focus keyword index status monitoring runs through each section so you can map tool choices to team size and risk.
Key takeaways
- Index status monitoring at scale depends on exports, APIs, and logs, not on manual URL Inspection for every URL.
- Build one warehouse sheet or table with URL, template, status, last crawl, and action so trends stay comparable week over week.
- Alert on deltas and clusters by template, not on single URL flips that often reflect sampling or canonical consolidation.
- Pair Search Console data with server logs to separate discovery gaps from quality decisions before assigning fixes.
- Why manual checks fail past 50 URLs
- Search Console API workflows for index status monitoring
- Spreadsheet plus script monitoring for small teams
- Log based monitoring that proves Googlebot visits
- Third party trackers compared without hype
- Alerting rules that avoid noise
- A practical monitoring stack for 100, 1000, and 100000 URLs
- FAQ
- Sources
- Further reading
 <!-- IMAGE-PROMPT cover: 1200x630, DependsIt brand, deep charcoal #121212 background, vibrant mint #22E3B0 accent glow, thin node-network line art, Clash Display style bold heading space on left, General Sans clean labels, subject: index status monitoring at scale for large URL sets for SEO teams, flat vector, high contrast, accessible, no photorealistic faces, no text smaller than 24px, no em dash in rendered text, export PNG then cwebp -q 82 to WEBP -->
Why manual checks fail past 50 URLs
Manual checks work for launches and spot questions. They fail for ongoing monitoring because Search Console samples lists, inspection quotas limit throughput, and human review cannot run daily across thousands of URLs. Teams that persist with manual methods end up checking the same homepage set while deep templates drift unnoticed. The shift to index status monitoring starts by accepting sampling, automating exports, and reviewing deltas by template instead of opening URLs one by one. Small teams that still monitor indexed pages by hand often try a free bulk index checker for triage before building exports.
Sample lists cap at 1,000 rows per reason, so large sites never see the full affected set without segmentation by sitemap, directory, or date. In practice this means you should record the exact state, the date, and the sample URL before changing anything. Owners who skip this note often repeat fixes that already failed. A short log with before and after values makes the next review faster and keeps the team aligned on what was tried and what remains open.
URL Inspection quotas and human time make daily checks of thousands of URLs impractical and inconsistent across team members. For most small teams this step takes less than fifteen minutes per URL once the process is documented. Open the relevant report, copy the status wording exactly, and save a screenshot or export for reference. That evidence helps you compare later crawl cycles and helps developers reproduce the issue without guesswork about which template or setting caused it.
Status wording changes meaning by context, so manual readers misclassify duplicates, consolidation, and quality decisions without grouping. A common mistake is to treat one URL as proof for the whole site. Instead group URLs by template, section, and publish date to see whether the pattern is isolated or broad. Template level patterns point to code or configuration. Scattered patterns point to content depth, linking, or demand signals that need steady improvement across many pages.
Spreadsheet drift occurs when each analyst keeps a private copy with different columns, dates, and property scopes that cannot be compared. When you apply a fix, change one variable at a time and note the date in your site log. If you change content, links, and technical settings on the same day, you will not know which action moved the count. Clear notes also help future audits because anyone can trace why a setting exists and whether it should stay or be revised.
Alert fatigue follows when every single URL flip triggers a message, which trains teams to ignore the channel that should catch real drops. Measurement matters more than activity. After the change, check the same report on the same weekday for two to three cycles and compare valid counts, excluded counts, and sample URLs. Small steady gains beat sudden spikes. If numbers stall, revisit grouping and sampling instead of repeating the same submission or request on every URL.
Key checks for why manual checks fail past 50 urls:
- Count canonical indexable URLs by template before choosing tooling.
- Document property scope and canonical patterns used for all counts.
- Replace per URL spot checks with weekly delta reviews by reason.
- Consolidate sheets into one table with fixed columns and owners.
- Define what counts as an alert before adding notifications.
Use this quick reference while working on why manual checks fail past 50 urls.
| Check | What to confirm | Tool |
|---|---|---|
| Scale | Manual limit | Needed shift |
| Under 50 URLs | Weekly inspection viable | Shared sheet with dates |
| 50 to 1,000 URLs | Sampling starts | Segmented exports by template |
| 1,000 to 50,000 URLs | Exports required | API plus warehouse |
| Over 50,000 URLs | Automation only | Pipelines plus log join |
The goal is not to inspect more URLs by hand. It is to inspect fewer URLs with better context. Segment by template, review deltas, and validate with samples. That approach catches template regressions within one cycle while keeping human effort flat as URL counts grow. The next sections map the specific tools that make this shift possible for small, midsize, and large operations.
Search Console API workflows for index status monitoring
Search Console provides the most authoritative bulk view for verified properties. The Pages indexing report shows Valid and Excluded groups with samples. Exports provide up to 1,000 URLs per reason for offline grouping. API access enables scheduled pulls for trend tables without manual downloads. For index status monitoring, treat these as the system of record and join other sources to them, not the other way around. An index tracking tool that stores daily snapshots enables automated index checks without manual downloads.
Pages report trends show Valid growth or decline over time, which matters more than any single day snapshot for stakeholder reporting. For most small teams this step takes less than fifteen minutes per URL once the process is documented. Open the relevant report, copy the status wording exactly, and save a screenshot or export for reference. That evidence helps you compare later crawl cycles and helps developers reproduce the issue without guesswork about which template or setting caused it.
Reason level exports reveal whether drops concentrate in noindex, duplicate, crawled, discovered, or server error buckets that map to owners. A common mistake is to treat one URL as proof for the whole site. Instead group URLs by template, section, and publish date to see whether the pattern is isolated or broad. Template level patterns point to code or configuration. Scattered patterns point to content depth, linking, or demand signals that need steady improvement across many pages.
Segmented exports by sitemap file, directory, or date range bypass the 1,000 row cap and expose which section drives the total change. When you apply a fix, change one variable at a time and note the date in your site log. If you change content, links, and technical settings on the same day, you will not know which action moved the count. Clear notes also help future audits because anyone can trace why a setting exists and whether it should stay or be revised.
Scheduled API pulls create a daily history table that supports week over week deltas, release correlation, and regression alerts. Measurement matters more than activity. After the change, check the same report on the same weekday for two to three cycles and compare valid counts, excluded counts, and sample URLs. Small steady gains beat sudden spikes. If numbers stall, revisit grouping and sampling instead of repeating the same submission or request on every URL.
Property sets and domain properties unify www, apex, http, and https variants so counts do not split across legacy properties. Documentation keeps this work repeatable. Store the export, the fix date, the template name, and the validation result in one place that the whole team can find. When ownership changes or when a plugin updates, that record prevents regressions and shortens debugging because the prior context is already written down and easy to scan.
Key checks for search console api and bulk export workflows:
- Use a domain property or consistent canonical property for all history.
- Export active reasons weekly and archive files with dates.
- Add template, inlinks, word count, and sitemap columns to every export.
- Schedule API pulls at the same hour to keep day boundaries stable.
- Join API history to deploy log for release correlation.
Use this quick reference while working on search console api and bulk export workflows.
| Check | What to confirm | Tool |
|---|---|---|
| Source | Grain | Use for |
| Pages report UI | Reason plus sample | Weekly triage and prioritization |
| CSV export | Up to 1,000 URLs | Template grouping and assignment |
| API pulls | Daily history | Trend lines and alerts |
| Sitemap filter | Section slice | Isolating template regressions |
| Domain property | Unified host | Avoiding split counts |
For context on the fix side of these reports, see Crawled, Currently Not Indexed: 9 Fixes That Actually Work. Monitoring tells you where the cluster sits. That guide maps each cluster to ordered actions. Keep the two workflows linked. Every alert should point to a runbook entry with owner, validation steps, and expected timeline so detection turns into recovery without extra triage meetings.
Spreadsheet plus script monitoring for small teams
Teams under 1,000 URLs do not need a data warehouse on day one. A well structured sheet plus a small script covers most needs. The sheet holds the canonical URL list with template and priority. The script fetches sitemap status, header status, and Search Console exports on schedule. Conditional formatting highlights week over week changes. This setup runs in hours, costs little, and teaches the discipline that larger pipelines later automate.
A canonical URL inventory with template, owner, publish date, and priority prevents monitoring from drifting to whatever was checked last. A common mistake is to treat one URL as proof for the whole site. Instead group URLs by template, section, and publish date to see whether the pattern is isolated or broad. Template level patterns point to code or configuration. Scattered patterns point to content depth, linking, or demand signals that need steady improvement across many pages.
Header scripts that record status code, canonical header, robots header, and response time catch technical regressions before content reviews. When you apply a fix, change one variable at a time and note the date in your site log. If you change content, links, and technical settings on the same day, you will not know which action moved the count. Clear notes also help future audits because anyone can trace why a setting exists and whether it should stay or be revised.
Sitemap presence checks confirm each canonical appears once as 200 with accurate lastmod, which keeps discovery signals clean. Measurement matters more than activity. After the change, check the same report on the same weekday for two to three cycles and compare valid counts, excluded counts, and sample URLs. Small steady gains beat sudden spikes. If numbers stall, revisit grouping and sampling instead of repeating the same submission or request on every URL.
Week over week delta columns with simple thresholds surface real drops while ignoring one row sampling noise in exports. Documentation keeps this work repeatable. Store the export, the fix date, the template name, and the validation result in one place that the whole team can find. When ownership changes or when a plugin updates, that record prevents regressions and shortens debugging because the prior context is already written down and easy to scan.
Versioned weekly tabs or a history sheet preserve evidence for postmortems and make release impact visible without extra tooling. In practice this means you should record the exact state, the date, and the sample URL before changing anything. Owners who skip this note often repeat fixes that already failed. A short log with before and after values makes the next review faster and keeps the team aligned on what was tried and what remains open.
Key checks for spreadsheet plus script monitoring for small teams:
- Freeze the canonical URL list and dedupe variants before adding formulas.
- Record script run time and property scope in the sheet header.
- Use thresholds such as five URL or two percent change by template for highlights.
- Protect history tabs from edits so comparisons stay trustworthy.
- Assign one owner for sheet structure and one per template for fixes.
Use this quick reference while working on spreadsheet plus script monitoring for small teams.
| Check | What to confirm | Tool |
|---|---|---|
| Column | Source | Review cadence |
| Canonical URL | CMS export | On publish and weekly |
| Template | URL pattern | On template change |
| Status code | Header script | Daily for priority |
| Sitemap present | Sitemap scan | Weekly |
| SC reason | Export join | Weekly |
Keep this system boring and consistent. The same columns, the same weekday, the same property scope. When the sheet stays stable, deltas mean something. When columns change weekly, every review starts with cleanup instead of decisions. Small teams that master this discipline migrate to larger tooling with clean requirements instead of migrating chaos.
 <!-- IMAGE-PROMPT diagram-01: 1600px max, DependsIt brand mint #22E3B0 on charcoal #121212, node-network line art, Clash Display style headings, General Sans clean labels, subject: Search Console API to warehouse to alert pipeline for index monitoring, flat vector, accessible, no em dash in rendered text -->
Log based monitoring that proves Googlebot visits
Search Console shows recorded status. Logs show actual fetching. Joining the two separates discovery problems from evaluation problems at scale. If a template shows zero Googlebot hits for weeks, no content edit will move it until discovery improves. If a template shows steady 200 hits yet stays excluded, effort belongs on differentiation and consolidation. Log joins sound heavy, but a weekly aggregated view by template is enough for most monitoring decisions. Many teams pair exports with index monitoring software to track page indexing alongside fetch proof.
Aggregate hits by template and response code instead of storing every line in the monitoring view, which keeps queries fast and readable. When you apply a fix, change one variable at a time and note the date in your site log. If you change content, links, and technical settings on the same day, you will not know which action moved the count. Clear notes also help future audits because anyone can trace why a setting exists and whether it should stay or be revised.
Verify Googlebot identity with reverse DNS on sampled IPs so reports do not inflate discovery with imposter crawlers and tools. Measurement matters more than activity. After the change, check the same report on the same weekday for two to three cycles and compare valid counts, excluded counts, and sample URLs. Small steady gains beat sudden spikes. If numbers stall, revisit grouping and sampling instead of repeating the same submission or request on every URL.
Track median time to first byte and error rate by template because slow or flaky templates get deprioritized even with good content. Documentation keeps this work repeatable. Store the export, the fix date, the template name, and the validation result in one place that the whole team can find. When ownership changes or when a plugin updates, that record prevents regressions and shortens debugging because the prior context is already written down and easy to scan.
Join last hit date to Search Console last crawl date to spot logging gaps, property mismatches, and CDN filtering that hides hits. In practice this means you should record the exact state, the date, and the sample URL before changing anything. Owners who skip this note often repeat fixes that already failed. A short log with before and after values makes the next review faster and keeps the team aligned on what was tried and what remains open.
Retain raw logs for 30 to 90 days while keeping aggregated template history for a year to support seasonal comparisons. For most small teams this step takes less than fifteen minutes per URL once the process is documented. Open the relevant report, copy the status wording exactly, and save a screenshot or export for reference. That evidence helps you compare later crawl cycles and helps developers reproduce the issue without guesswork about which template or setting caused it.
Key checks for log based monitoring that proves googlebot visits:
- Normalize variants and parameters before aggregating by template.
- Confirm crawler identity on a sample each month.
- Chart hits and Valid counts together to see fetch versus index lag.
- Alert on error rate spikes before Valid counts fall.
- Document CDN and WAF rules that affect log completeness.
Use this quick reference while working on log based monitoring that proves googlebot visits.
| Check | What to confirm | Tool |
|---|---|---|
| Join result | Interpretation | Owner |
| No hits plus excluded | Discovery gap | SEO plus content ops |
| Hits plus excluded | Evaluation gap | Content plus template |
| Hits plus valid | Healthy | Monitor only |
| Errors plus drop | Hosting regression | Engineering |
| Stale hits | Scheduling lag | Links plus sitemaps |
Logs add proof to status changes. When stakeholders ask why Valid fell after a release, a template level hit and error chart answers in one view. Without logs, the same question triggers days of debate about content versus technical causes. Build the join once, refresh weekly, and keep the definition of each column fixed so history remains comparable.
import requests
URLS=["https://example.com/p1/","https://example.com/p2/"]
for u in URLS:
    r=requests.head(u,timeout=15)
    print(u,r.status_code,r.headers.get("X-Robots-Tag"))
Run the snippet on staging first, then on production for one sample URL. Save the output with the date so later reviews can compare behavior before and after the fix without rerunning every manual step from memory.
Third party trackers compared without hype
Rank trackers, index checkers, and crawler suites promise bulk answers, but methods vary widely. Some query public search operators that estimate. Some store historical snapshots without live verification. Some crawl as a bot that is not Googlebot. For index status monitoring, third party tools are useful for change detection and workflow, but they cannot replace Search Console as the source of truth. Evaluate them on method, freshness, and export quality rather than marketing claims.
Operator based checkers scale cheaply but inherit site: estimation error, so they suit triage and cannot prove single URL status. Measurement matters more than activity. After the change, check the same report on the same weekday for two to three cycles and compare valid counts, excluded counts, and sample URLs. Small steady gains beat sudden spikes. If numbers stall, revisit grouping and sampling instead of repeating the same submission or request on every URL.
SERP snapshot tools track visibility and URL presence for target queries, which helps prioritize but does not equal index coverage. Documentation keeps this work repeatable. Store the export, the fix date, the template name, and the validation result in one place that the whole team can find. When ownership changes or when a plugin updates, that record prevents regressions and shortens debugging because the prior context is already written down and easy to scan.
Site crawlers audit eligibility at scale by finding noindex, canonical, status, and duplicate patterns before Search Console reflects them. In practice this means you should record the exact state, the date, and the sample URL before changing anything. Owners who skip this note often repeat fixes that already failed. A short log with before and after values makes the next review faster and keeps the team aligned on what was tried and what remains open.
Log analyzers turn raw hits into template dashboards that complement coverage reports with fetch proof and performance context. For most small teams this step takes less than fifteen minutes per URL once the process is documented. Open the relevant report, copy the status wording exactly, and save a screenshot or export for reference. That evidence helps you compare later crawl cycles and helps developers reproduce the issue without guesswork about which template or setting caused it.
API wrappers and warehouse connectors add scheduling, history, and alerting around Search Console data without changing its meaning. A common mistake is to treat one URL as proof for the whole site. Instead group URLs by template, section, and publish date to see whether the pattern is isolated or broad. Template level patterns point to code or configuration. Scattered patterns point to content depth, linking, or demand signals that need steady improvement across many pages.
Key checks for third party trackers compared without hype:
- Ask vendors how status is determined and how often each URL is refreshed.
- Require exports with URL, date, status, and method for auditability.
- Trial with a known set of Valid and Excluded URLs to test accuracy.
- Prefer tools that join to Search Console rather than replace it.
- Review cost per 1,000 URLs against internal script costs.
Use this quick reference while working on third party trackers compared without hype.
| Check | What to confirm | Tool |
|---|---|---|
| Tool type | Strength | Limitation |
| Operator checker | Cheap bulk hints | Estimates, not proof |
| SERP tracker | Visibility trends | Query dependent |
| Site crawler | Eligibility audit | Not Google record |
| Log analyzer | Fetch proof | Needs log access |
| SC connector | History plus alerts | Still sampled |
Choose third party tools for workflow speed, not for authority. The authority stays with Search Console, logs, and headers. A good vendor shortens time from detection to assignment with clean exports and stable history. A poor vendor adds conflicting numbers that undermine trust. Pilot with one section, compare against Search Console deltas for a month, then expand only if the tool reduces triage time.
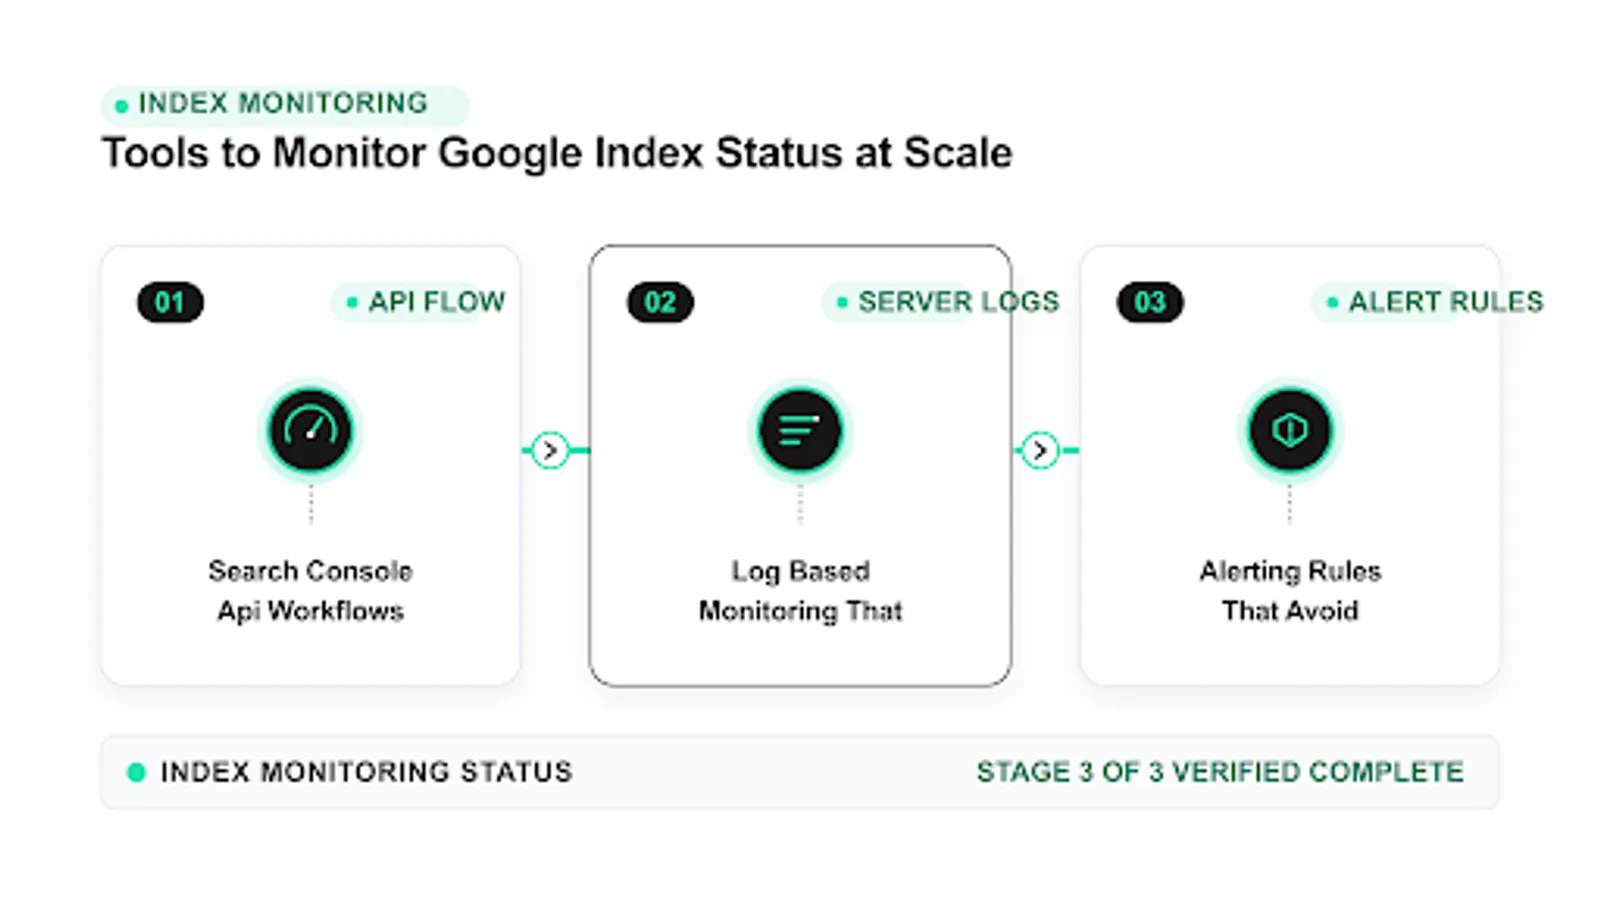 <!-- IMAGE-PROMPT workflow-02: 1600px max, DependsIt brand mint #22E3B0 on charcoal #121212 or white, node-network line art, Clash Display style headings, General Sans clean labels, subject: alert triage workflow for index drops from detection to fix to review, flat vector, accessible, no em dash in rendered text -->
Alerting rules that avoid noise
Monitoring without alerting misses regressions. Alerting without thresholds creates noise that teams mute. Effective index status monitoring alerts on meaningful deltas by template and reason, with clear severity and owner. Single URL flips rarely deserve a page. A five percent Valid drop on a product template deserves immediate review. Design rules around impact, persistence, and ownership so every alert maps to action.
Delta thresholds by template filter sampling noise better than absolute totals, especially for sections with frequent publishing and pruning. Documentation keeps this work repeatable. Store the export, the fix date, the template name, and the validation result in one place that the whole team can find. When ownership changes or when a plugin updates, that record prevents regressions and shortens debugging because the prior context is already written down and easy to scan.
Persistence rules that require two consecutive runs reduce false pages from one day export variance and delayed processing. In practice this means you should record the exact state, the date, and the sample URL before changing anything. Owners who skip this note often repeat fixes that already failed. A short log with before and after values makes the next review faster and keeps the team aligned on what was tried and what remains open.
Reason specific routing sends noindex spikes to engineering, duplicate spikes to content ops, and error spikes to hosting on call. For most small teams this step takes less than fifteen minutes per URL once the process is documented. Open the relevant report, copy the status wording exactly, and save a screenshot or export for reference. That evidence helps you compare later crawl cycles and helps developers reproduce the issue without guesswork about which template or setting caused it.
Priority weighting ensures money pages and new launches alert faster than deep archives with low business impact. A common mistake is to treat one URL as proof for the whole site. Instead group URLs by template, section, and publish date to see whether the pattern is isolated or broad. Template level patterns point to code or configuration. Scattered patterns point to content depth, linking, or demand signals that need steady improvement across many pages.
Quiet hours and digest options keep overnight sampling jitter from paging people while still logging the event for morning review. When you apply a fix, change one variable at a time and note the date in your site log. If you change content, links, and technical settings on the same day, you will not know which action moved the count. Clear notes also help future audits because anyone can trace why a setting exists and whether it should stay or be revised.
Key checks for alerting rules that avoid noise:
- Alert on persisted deltas, not single run flips.
- Include template, reason, sample URLs, and last deploy in every alert.
- Tune thresholds after two quiet weeks and one real incident.
- Provide a muted digest for low priority sections.
- Review and prune rules quarterly.
Use this quick reference while working on alerting rules that avoid noise.
| Check | What to confirm | Tool |
|---|---|---|
| Rule | Example threshold | Routes to |
| Valid drop product | Down 5 percent or 50 URLs | SEO plus engineering |
| Error spike | 5xx over 1 percent | Hosting on call |
| Noindex spike | Up 20 URLs day over day | Release owner |
| New URLs not valid | Under 80 percent in 14 days | Content ops |
| Archive drift | Slow 4 week decline | Backlog groom |
Treat alerts as runbook triggers. Each alert should link to validation steps, sample inspection guidance, and rollback contacts. When an alert fires, the responder knows what to open first and what counts as resolved. Without that link, monitoring creates tickets that bounce between teams while Valid counts keep falling.
A practical monitoring stack for 100, 1000, and 100000 URLs
Tool choice depends on URL count, publish velocity, and team skills. A 100 URL blog needs a sheet and weekly exports. A 1,000 URL store needs scheduled scripts and template dashboards. A 100,000 URL marketplace needs pipelines, warehouses, and log joins with role based triage. This section maps three reference stacks so you can start where you are and grow without rebuilding from scratch each year.
For 100 URLs, a canonical sheet plus weekly Pages exports and five sample inspections catches most issues within one cycle. In practice this means you should record the exact state, the date, and the sample URL before changing anything. Owners who skip this note often repeat fixes that already failed. A short log with before and after values makes the next review faster and keeps the team aligned on what was tried and what remains open.
For 1,000 URLs, add header scripts, sitemap scans, and Search Console API history with template level delta views refreshed weekly. For most small teams this step takes less than fifteen minutes per URL once the process is documented. Open the relevant report, copy the status wording exactly, and save a screenshot or export for reference. That evidence helps you compare later crawl cycles and helps developers reproduce the issue without guesswork about which template or setting caused it.
For 100,000 URLs, add daily partitioned pipelines, log aggregation by template, and automated reason routing with severity levels. A common mistake is to treat one URL as proof for the whole site. Instead group URLs by template, section, and publish date to see whether the pattern is isolated or broad. Template level patterns point to code or configuration. Scattered patterns point to content depth, linking, or demand signals that need steady improvement across many pages.
Across all sizes, keep one definition for canonical, template, and Valid so reports remain comparable as tooling changes. When you apply a fix, change one variable at a time and note the date in your site log. If you change content, links, and technical settings on the same day, you will not know which action moved the count. Clear notes also help future audits because anyone can trace why a setting exists and whether it should stay or be revised.
Review stack cost quarterly by comparing engineering hours, vendor fees, and time to detection for the last three incidents. Measurement matters more than activity. After the change, check the same report on the same weekday for two to three cycles and compare valid counts, excluded counts, and sample URLs. Small steady gains beat sudden spikes. If numbers stall, revisit grouping and sampling instead of repeating the same submission or request on every URL.
Key checks for a practical monitoring stack for 100, 1000, and 100000 urls:
- Start with inventory and exports before buying tools.
- Automate history before adding more alert channels.
- Add logs once fetch versus evaluation questions repeat.
- Document definitions so new hires read reports correctly.
- Rehearse one drop scenario per quarter.
Use this quick reference while working on a practical monitoring stack for 100, 1000, and 100000 urls.
| Check | What to confirm | Tool |
|---|---|---|
| Size | Core stack | Refresh |
| 100 URLs | Sheet plus exports | Weekly |
| 1,000 URLs | Scripts plus API history | Weekly plus daily headers |
| 100,000 URLs | Warehouse plus logs | Daily with weekly review |
| All sizes | Runbooks plus owners | On every alert |
| Growth trigger | Missed regression | Upgrade one layer |
Pick the smallest stack that catches regressions within one cycle for your publish rate. Complexity should follow pain, not anticipation. When a smaller stack repeatedly misses template drops or wastes hours on manual pulls, upgrade one layer at a time and keep column definitions stable. Steady evolution preserves history, which is the most valuable asset in long term index tracking.
FAQ
How often should index status be checked at scale?
Weekly delta reviews suit most sites, with daily header and error checks for large catalogs. Daily full coverage pulls add noise unless publish velocity is high. Tie cadence to crawl cycles and release frequency. After major releases, check error rates daily for one week, then return to the normal weekly Valid versus Excluded comparison.
What is the single most useful metric for large sites?
Valid count trend by template over four to eight weeks. Absolute totals mislead because publishing and pruning shift denominators. Template trends show whether product, category, article, or faceted sections gain or lose ground. Pair the trend with error rate and last hit data to assign the right owner quickly. An index tracking dashboard that helps you monitor thousands urls in one view makes this trend readable for stakeholders.
Can third party index checkers replace Search Console?
No. They help with workflow, history, and triage, but Search Console remains the authoritative record for verified properties. Use third party tools to detect change faster or to audit eligibility at scale, then confirm material decisions with Search Console wording, headers, and logs before editing templates.
How do we avoid alert fatigue?
Alert on persisted template deltas with reason routing and severity levels. Require two consecutive runs for pages, include samples and deploy context, and send low priority drift as a digest. Review thresholds quarterly. Teams that alert on every single URL flip quickly mute the channel and miss real template regressions. Well tuned index status alerts catch real index drop alerts without paging for sampling noise.
How do logs fit into index monitoring?
Logs prove fetching by template and response code. Join last hit and error rate to coverage trends to separate discovery gaps from quality decisions. No hits with exclusion means strengthen discovery. Steady 200 hits with exclusion means improve differentiation and consolidation. Keep aggregated template history for a year for seasonal review.
When should we upgrade from sheets to pipelines?
When weekly exports, manual joins, and sample checks repeatedly miss regressions or consume more than half a day per week. Upgrade one layer at a time, starting with API history, then header automation, then log joins. Keep column definitions stable so history stays comparable across the migration.
Sources
- Google Search Central: Crawl and index troubleshooting
- Google Search Central: URL Inspection tool help