JavaScript SEO: Why Rendering Delays Your Indexing

JavaScript can delay indexing by days or weeks even when pages look perfect in a browser. Google fetches the initial HTML first, then queues many JavaScript pages for a second rendering pass before content counts toward indexing. During that gap, headings, body copy, links, and metadata may be invisible to indexing decisions. This guide is for developers, SEOs, and publishers who ship JavaScript pages that must index quickly. You will learn how the two wave process works, how rendering choices affect delay, how to test what Googlebot sees, and which fixes shorten the wait. The focus keyword javascript seo indexing appears throughout so you can tie each technical choice to measurable indexing outcomes.
Key takeaways
- JavaScript seo indexing delays happen because many pages wait for a second rendering pass before content counts.
- Server side rendering or prerendering puts critical content in initial HTML and shortens the delay for key templates.
- Test with URL Inspection live test plus rendered versus source diffs to prove what Googlebot actually sees.
- Fix blocked resources, slow scripts, missing status codes, and weak internal links to help rendered pages index faster.
- How Google processes JavaScript in two waves
- Client side rendering versus server side rendering versus hydration
- How to test javascript seo indexing with live render checks
- Common JavaScript patterns that block indexing
- Fixes that shorten the rendering delay
- Measuring rendering delay with logs and Search Console
- A shipping checklist for JavaScript pages that must index fast
- FAQ
- Sources
- Further reading
 <!-- IMAGE-PROMPT cover: 1200x630, DependsIt brand, deep charcoal #121212 background, vibrant mint #22E3B0 accent glow, thin node-network line art, Clash Display style bold heading space on left, General Sans clean labels, subject: JavaScript rendering delay effects on Google indexing for dynamic pages, flat vector, high contrast, accessible, no photorealistic faces, no text smaller than 24px, no em dash in rendered text, export PNG then cwebp -q 82 to WEBP -->
How Google processes JavaScript in two waves
Googlebot fetches HTML, discovers resources, then often defers JavaScript execution to a rendering queue that runs later. Indexing decisions for JavaScript dependent content wait for that second pass. The delay varies by site authority, crawl demand, resource weight, and error rate. For javascript seo indexing, this means publish time and index time can diverge sharply on client rendered templates while server rendered templates behave closer to static HTML. Teams studying javascript rendering google behavior should measure js site indexing delay by template to quantify the gap.
First wave fetch captures initial HTML, status code, headers, and discovered resource URLs without executing heavy scripts. In practice this means you should record the exact state, the date, and the sample URL before changing anything. Owners who skip this note often repeat fixes that already failed. A short log with before and after values makes the next review faster and keeps the team aligned on what was tried and what remains open.
Second wave rendering executes scripts, builds the DOM, and exposes content that was absent from initial HTML for indexing. For most small teams this step takes less than fifteen minutes per URL once the process is documented. Open the relevant report, copy the status wording exactly, and save a screenshot or export for reference. That evidence helps you compare later crawl cycles and helps developers reproduce the issue without guesswork about which template or setting caused it.
Queue time stretches when scripts are large, third parties are slow, or error rates force retries that consume rendering budget. A common mistake is to treat one URL as proof for the whole site. Instead group URLs by template, section, and publish date to see whether the pattern is isolated or broad. Template level patterns point to code or configuration. Scattered patterns point to content depth, linking, or demand signals that need steady improvement across many pages.
Links discovered only after rendering enter crawl scheduling later, which delays discovery of deep pages behind app navigation. When you apply a fix, change one variable at a time and note the date in your site log. If you change content, links, and technical settings on the same day, you will not know which action moved the count. Clear notes also help future audits because anyone can trace why a setting exists and whether it should stay or be revised.
Metadata set only in script may miss the first evaluation, which affects canonical, robots, and title decisions until rendering completes. Measurement matters more than activity. After the change, check the same report on the same weekday for two to three cycles and compare valid counts, excluded counts, and sample URLs. Small steady gains beat sudden spikes. If numbers stall, revisit grouping and sampling instead of repeating the same submission or request on every URL.
Key checks for how google processes javascript in two waves:
- Confirm which templates depend on script for main content versus enhancement.
- Measure supplement payload size and third party count per template.
- Check resource blocking in robots before assuming rendering works.
- Compare publish date with first Valid date by template.
- Prioritize server output fixes for money templates first.
Use this quick reference while working on how google processes javascript in two waves.
| Check | What to confirm | Tool |
|---|---|---|
| Stage | What Google sees | Index effect |
| Fetch | Initial HTML plus headers | Eligibility and discovery |
| Render queue | Wait for resources | Delay for JS content |
| Render | Built DOM plus text | Content counts |
| Post render | Links and metadata | Scheduling and consolidation |
Think in two clocks. Fetch clock measures server and robots health. Render clock measures script weight, errors, and queue demand. When indexing lags on JavaScript templates while static templates move quickly, render clock is usually the cause. The next sections map rendering choices and tests that shorten that second clock without rewriting the whole front end.
Client side rendering versus server side rendering versus hydration
Rendering architecture determines how much content exists in initial HTML. Client side rendering sends a shell and builds content in the browser. Server side rendering sends full HTML for each request. Hydration and static generation sit between, with prerendered HTML plus client interactivity. For indexing speed, more meaningful HTML on first response usually means less waiting, fewer failure modes, and clearer status and metadata signals. Any client side rendering seo audit should compare ssr vs csr indexing lag for the same template before choosing a rewrite.
Client side rendering delays all body content until scripts run, which maximizes queue dependence and failure surface for indexing. For most small teams this step takes less than fifteen minutes per URL once the process is documented. Open the relevant report, copy the status wording exactly, and save a screenshot or export for reference. That evidence helps you compare later crawl cycles and helps developers reproduce the issue without guesswork about which template or setting caused it.
Server side rendering exposes headings, copy, links, and metadata on fetch, so indexing can proceed even if later hydration is slow. A common mistake is to treat one URL as proof for the whole site. Instead group URLs by template, section, and publish date to see whether the pattern is isolated or broad. Template level patterns point to code or configuration. Scattered patterns point to content depth, linking, or demand signals that need steady improvement across many pages.
Static generation with hydration gives fast first HTML for known routes while keeping app feel, which suits content heavy sections. When you apply a fix, change one variable at a time and note the date in your site log. If you change content, links, and technical settings on the same day, you will not know which action moved the count. Clear notes also help future audits because anyone can trace why a setting exists and whether it should stay or be revised.
Dynamic rendering serves static HTML to crawlers and app HTML to users, which adds maintenance and should be a bridge, not a permanent crutch. Measurement matters more than activity. After the change, check the same report on the same weekday for two to three cycles and compare valid counts, excluded counts, and sample URLs. Small steady gains beat sudden spikes. If numbers stall, revisit grouping and sampling instead of repeating the same submission or request on every URL.
Hybrid routes with server output for landing and listing pages plus client rendering for private app screens balance speed and effort. Documentation keeps this work repeatable. Store the export, the fix date, the template name, and the validation result in one place that the whole team can find. When ownership changes or when a plugin updates, that record prevents regressions and shortens debugging because the prior context is already written down and easy to scan.
Key checks for client side rendering versus server side rendering versus hydration:
- Inventory routes by rendering pattern before choosing fixes.
- Prefer server output for public indexable routes with search demand.
- Isolate private app screens from indexable marketing routes.
- Document dynamic rendering as temporary with an exit plan.
- Test each pattern with live render diffs, not assumptions.
Use this quick reference while working on client side rendering versus server side rendering versus hydration.
| Check | What to confirm | Tool |
|---|---|---|
| Pattern | First HTML | Index delay risk |
| Client only | Shell only | Highest |
| Server rendered | Full content | Lowest |
| Static plus hydrate | Full for routes | Low |
| Dynamic render | Full for bots | Medium plus maintenance |
| Hybrid | Full for key routes | Controlled |
Architecture choice is a tradeoff between team skills, hosting, and search value. Public pages that must rank deserve full first HTML. Private screens behind login do not. When full rewrites are out of scope, prerender key routes and paginated hubs first. Those hubs carry discovery for the rest of the section, so improving them shortens delay for many child URLs at once.
How to test javascript seo indexing with live render checks
Browser views mislead because logged in sessions, cached bundles, and fast devices hide what a fresh crawler encounters. Reliable javascript seo indexing tests compare initial HTML with rendered DOM, check resource access, and run live Google tests that execute like indexing. Run the same three checks after every front end release so regressions surface before Valid counts fall.
View source versus inspect element diffs show which headings, copy, and links depend on script versus present on first response. A common mistake is to treat one URL as proof for the whole site. Instead group URLs by template, section, and publish date to see whether the pattern is isolated or broad. Template level patterns point to code or configuration. Scattered patterns point to content depth, linking, or demand signals that need steady improvement across many pages.
URL Inspection live test renders the page and reports fetched HTML, errors, blocked resources, and indexing allowed status for the property. When you apply a fix, change one variable at a time and note the date in your site log. If you change content, links, and technical settings on the same day, you will not know which action moved the count. Clear notes also help future audits because anyone can trace why a setting exists and whether it should stay or be revised.
Mobile friendly and rich result tests expose viewport, script, and structured data issues that affect rendering and eligibility. Measurement matters more than activity. After the change, check the same report on the same weekday for two to three cycles and compare valid counts, excluded counts, and sample URLs. Small steady gains beat sudden spikes. If numbers stall, revisit grouping and sampling instead of repeating the same submission or request on every URL.
Header and robots checks confirm status codes and resource allow lists, since one blocked bundle can blank large sections of rendered text. Documentation keeps this work repeatable. Store the export, the fix date, the template name, and the validation result in one place that the whole team can find. When ownership changes or when a plugin updates, that record prevents regressions and shortens debugging because the prior context is already written down and easy to scan.
No script and slow network throttling reveal fallback content and timeout behavior that heavy pages exhibit under constrained rendering. In practice this means you should record the exact state, the date, and the sample URL before changing anything. Owners who skip this note often repeat fixes that already failed. A short log with before and after values makes the next review faster and keeps the team aligned on what was tried and what remains open.
Key checks for how to test what googlebot actually sees:
- Save source and rendered snippets for the main heading and first 200 words.
- Record blocked resources and console errors with each live test.
- Test one listing and one detail URL per template, not just the homepage.
- Compare staging versus production renders after deploys.
- Archive test dates with release tags for correlation.
Use this quick reference while working on how to test what googlebot actually sees.
| Check | What to confirm | Tool |
|---|---|---|
| Test | What it proves | Frequency |
| Source versus DOM | Script dependence | Per release |
| Live URL test | Google render result | After fixes |
| Resource allow | Blocked bundles | Weekly for key templates |
| Throttle test | Timeout fragility | Before launch |
| Header check | Status and robots | Daily for priority |
Testing is the cheapest fix. Many teams discover that critical copy loads only after interaction, that canonicals are set late by script, or that a consent wall blocks rendering for bots. Those findings take an hour to prove with diffs and live tests, but take weeks to infer from Valid trends alone. Make render diffs part of definition of done for every front end change.
 <!-- IMAGE-PROMPT diagram-01: 1600px max, DependsIt brand mint #22E3B0 on charcoal #121212, node-network line art, Clash Display style headings, General Sans clean labels, subject: crawl to render to index two wave pipeline for JavaScript pages, flat vector, accessible, no em dash in rendered text -->
Common JavaScript patterns that block indexing
Beyond architecture, specific implementation patterns decide whether rendered content counts. Links that require click handlers without href values hide discovery. Content gated behind scroll or tab interaction stays absent from initial render. Status codes forced to 200 for missing app routes create soft 404 confusion. Metadata injected late misses early consolidation. Each pattern looks fine to users yet systematically weakens indexing signals across the template.
Button based navigation without anchor href values prevents crawlers from discovering and queuing child routes through normal link extraction. When you apply a fix, change one variable at a time and note the date in your site log. If you change content, links, and technical settings on the same day, you will not know which action moved the count. Clear notes also help future audits because anyone can trace why a setting exists and whether it should stay or be revised.
Infinite scroll without paginated fallback hides deep items from rendering and deprives them of stable URLs with internal context. Measurement matters more than activity. After the change, check the same report on the same weekday for two to three cycles and compare valid counts, excluded counts, and sample URLs. Small steady gains beat sudden spikes. If numbers stall, revisit grouping and sampling instead of repeating the same submission or request on every URL.
Client only 404 handling that keeps 200 status for missing routes causes thin duplicates that dilute quality signals for real pages. Documentation keeps this work repeatable. Store the export, the fix date, the template name, and the validation result in one place that the whole team can find. When ownership changes or when a plugin updates, that record prevents regressions and shortens debugging because the prior context is already written down and easy to scan.
Late injected canonical, robots, and title tags race the first evaluation and may be ignored until a later render completes. In practice this means you should record the exact state, the date, and the sample URL before changing anything. Owners who skip this note often repeat fixes that already failed. A short log with before and after values makes the next review faster and keeps the team aligned on what was tried and what remains open.
Blocked APIs, fonts, and bundles from robots or consent gates leave rendered DOM empty or partial, which reads as thin content. For most small teams this step takes less than fifteen minutes per URL once the process is documented. Open the relevant report, copy the status wording exactly, and save a screenshot or export for reference. That evidence helps you compare later crawl cycles and helps developers reproduce the issue without guesswork about which template or setting caused it.
Key checks for common javascript patterns that block indexing:
- Audit navigation for href presence on all indexable links.
- Provide paginated URLs for scroll loaded collections.
- Return correct status codes for missing app routes.
- Move canonical and robots to server output.
- Allow necessary resources in robots and consent logic.
Use this quick reference while working on common javascript patterns that block indexing.
| Check | What to confirm | Tool |
|---|---|---|
| Pattern | Symptom in tools | Fix direction |
| No href links | Few discovered children | Use anchors with URLs |
| Scroll only | Deep items missing | Add paginated routes |
| Soft app 404 | 200 on missing | Return 404 or 410 |
| Late metadata | Wrong canonical | Render critical tags server side |
| Blocked bundle | Empty render | Allow and slim resources |
For pages that look empty to crawlers despite full browsers, see Soft 404s: Why Google Thinks Your Pages Are Empty. The overlap is large because rendering failures often present as thin or empty pages in reports. Fixing link hrefs, status codes, and resource access usually moves more URLs than copy edits on the same templates.
fetch("/api/route-data?page=2").then(r=>console.log(r.status));Run the snippet on staging first, then on production for one sample URL. Save the output with the date so later reviews can compare behavior before and after the fix without rerunning every manual step from memory.
Fixes that shorten the rendering delay
Shortening delay means putting more meaning in first HTML, reducing work for the renderer, and stabilizing signals. Server render key routes, inline critical metadata, slim bundles, allow resources, and strengthen internal links so discovery does not wait for script execution. Each fix lowers queue time or failure rate, which compounds across thousands of URLs on the same template.
Server render or prerender landing, listing, and detail templates that carry search demand so headings and copy exist on fetch. Measurement matters more than activity. After the change, check the same report on the same weekday for two to three cycles and compare valid counts, excluded counts, and sample URLs. Small steady gains beat sudden spikes. If numbers stall, revisit grouping and sampling instead of repeating the same submission or request on every URL.
Inline title, description, canonical, robots, and structured data in server HTML to avoid late injection races. Documentation keeps this work repeatable. Store the export, the fix date, the template name, and the validation result in one place that the whole team can find. When ownership changes or when a plugin updates, that record prevents regressions and shortens debugging because the prior context is already written down and easy to scan.
Code split by route, defer non critical scripts, and remove unused third parties that inflate render cost without user value. In practice this means you should record the exact state, the date, and the sample URL before changing anything. Owners who skip this note often repeat fixes that already failed. A short log with before and after values makes the next review faster and keeps the team aligned on what was tried and what remains open.
Allow JS, CSS, and data endpoints in robots and consent flows for crawlers while preserving privacy choices for users where required. For most small teams this step takes less than fifteen minutes per URL once the process is documented. Open the relevant report, copy the status wording exactly, and save a screenshot or export for reference. That evidence helps you compare later crawl cycles and helps developers reproduce the issue without guesswork about which template or setting caused it.
Add server rendered hub links with descriptive anchors so child discovery proceeds from first HTML instead of waiting for app hydration. A common mistake is to treat one URL as proof for the whole site. Instead group URLs by template, section, and publish date to see whether the pattern is isolated or broad. Template level patterns point to code or configuration. Scattered patterns point to content depth, linking, or demand signals that need steady improvement across many pages.
Key checks for fixes that shorten the rendering delay:
- Prioritize fixes by template Valid gap and business value.
- Measure bundle size and render errors before and after each change.
- Validate with live tests on staging before production rollout.
- Roll out per template and track Valid movement for four weeks.
- Keep a fallback prerender path during migration.
Use this quick reference while working on fixes that shorten the rendering delay.
| Check | What to confirm | Tool |
|---|---|---|
| Fix | Effort | Delay reduction |
| Server key routes | Medium to high | Large for money templates |
| Inline metadata | Low | Medium for consolidation |
| Bundle slimming | Medium | Medium plus stability |
| Resource allow | Low | Large when blocked |
| Hub links | Low | Medium for discovery |
Sequence matters. Allow resources and fix status codes first because no rendering improvement overcomes blocks. Then add server output for metadata and hubs. Then slim bundles and expand server coverage. Validating each layer with live tests prevents shipping large rewrites that miss a one line robots block.
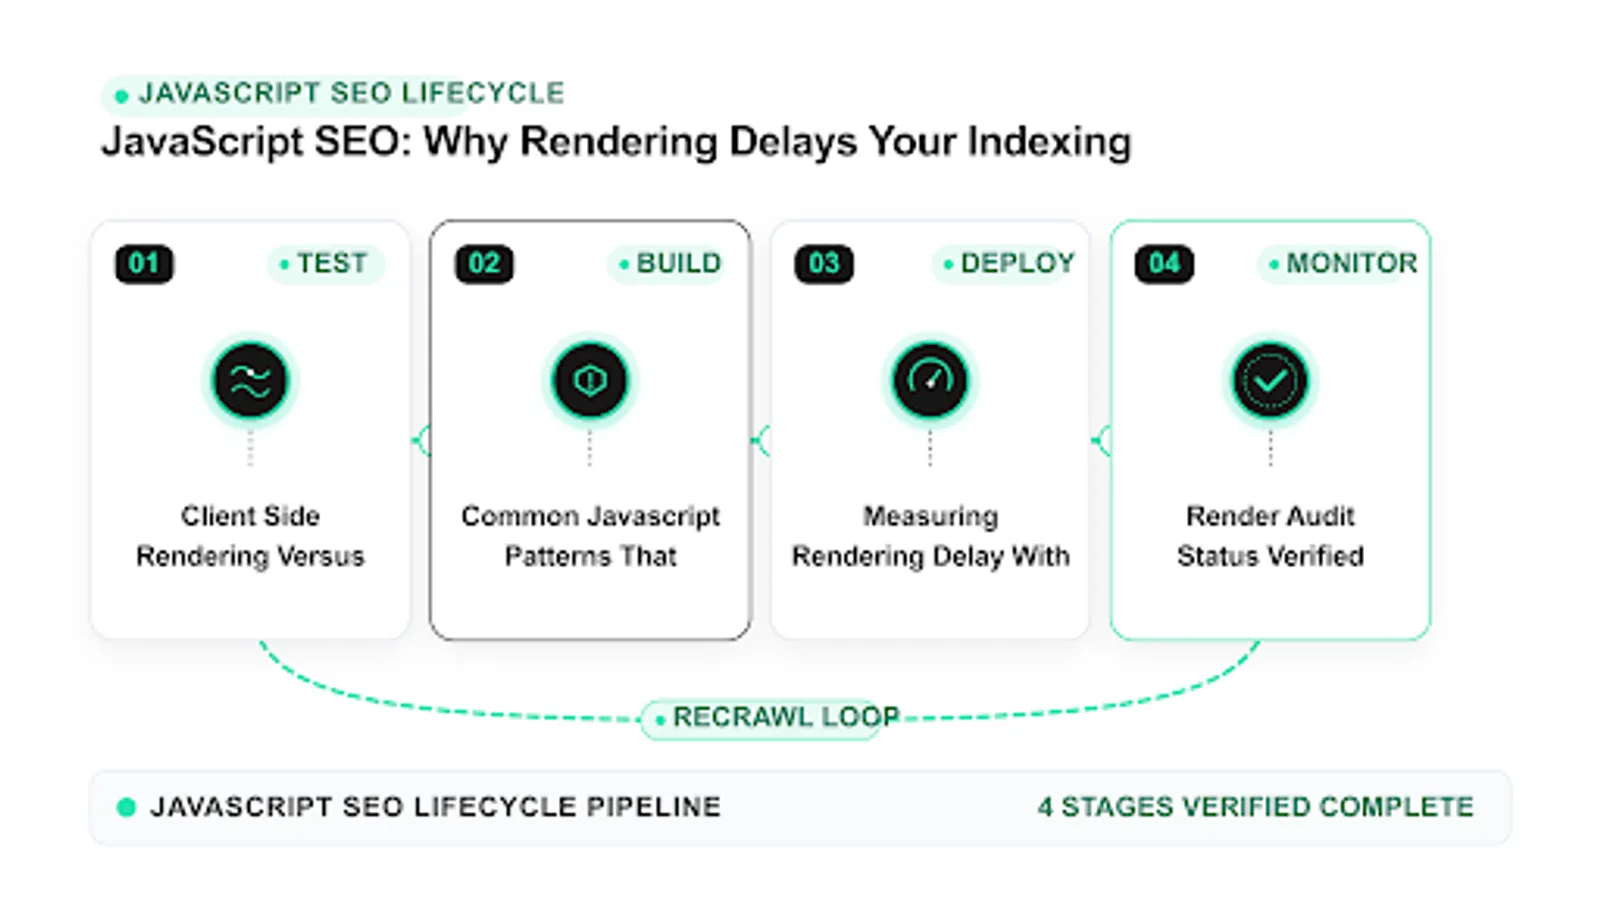 <!-- IMAGE-PROMPT workflow-02: 1600px max, DependsIt brand mint #22E3B0 on charcoal #121212 or white, node-network line art, Clash Display style headings, General Sans clean labels, subject: JavaScript SEO shipping checklist from test to deploy to monitoring, flat vector, accessible, no em dash in rendered text -->
Measuring rendering delay with logs and Search Console
Delay is measurable when you join publish dates, fetch dates, render evidence, and Valid dates by template. Logs show first and repeat Googlebot hits. Search Console shows last crawl and Coverage movement. Render tests show when content became visible. Together they reveal whether lag sits in discovery, rendering, or evaluation. Build a simple template dashboard and review it on the same weekday to keep comparisons fair.
First hit lag from publish to first Googlebot request isolates discovery problems from rendering and quality problems. Documentation keeps this work repeatable. Store the export, the fix date, the template name, and the validation result in one place that the whole team can find. When ownership changes or when a plugin updates, that record prevents regressions and shortens debugging because the prior context is already written down and easy to scan.
Fetch to Valid lag from first 200 hit to Valid status isolates rendering plus evaluation time for JavaScript templates. In practice this means you should record the exact state, the date, and the sample URL before changing anything. Owners who skip this note often repeat fixes that already failed. A short log with before and after values makes the next review faster and keeps the team aligned on what was tried and what remains open.
Resource error rate by template correlates with prolonged lag because failed bundles force retries that consume budget. For most small teams this step takes less than fifteen minutes per URL once the process is documented. Open the relevant report, copy the status wording exactly, and save a screenshot or export for reference. That evidence helps you compare later crawl cycles and helps developers reproduce the issue without guesswork about which template or setting caused it.
Last crawl versus last deploy comparison shows whether recent fixes have been seen or whether conclusions are premature. A common mistake is to treat one URL as proof for the whole site. Instead group URLs by template, section, and publish date to see whether the pattern is isolated or broad. Template level patterns point to code or configuration. Scattered patterns point to content depth, linking, or demand signals that need steady improvement across many pages.
Template comparison between static and script heavy sections quantifies the rendering penalty in days for stakeholder discussions. When you apply a fix, change one variable at a time and note the date in your site log. If you change content, links, and technical settings on the same day, you will not know which action moved the count. Clear notes also help future audits because anyone can trace why a setting exists and whether it should stay or be revised.
Key checks for measuring rendering delay with logs and search console:
- Store publish, first hit, last crawl, and Valid dates per sample URL.
- Aggregate lags by template, not just sitewide averages.
- Chart error rate alongside Valid trends.
- Annotate deploys and rendering fixes on the timeline.
- Review lags for two cycles before declaring success.
Use this quick reference while working on measuring rendering delay with logs and search console.
| Check | What to confirm | Tool |
|---|---|---|
| Metric | Formula | What it isolates |
| First hit lag | First hit minus publish | Discovery |
| Fetch to Valid | Valid date minus first 200 | Render plus evaluation |
| Error rate | Failed resource hits divided by total | Stability |
| Recrawl lag | Last crawl minus deploy | Freshness |
| Template gap | JS lag minus static lag | Render penalty |
Numbers turn rendering debates into staffing decisions. When data shows a nine day penalty for client only templates versus two days for server rendered equivalents, prioritizing server output becomes straightforward. Without measurement, the same debate repeats each quarter with opinions instead of lags.
A shipping checklist for JavaScript pages that must index fast
Fast indexing for JavaScript pages is a release discipline, not a one time audit. Every deploy should prove first HTML content, metadata presence, link hrefs, status codes, resource access, and performance before traffic shifts. This checklist fits into existing front end reviews and takes less than an hour per template once automated. Teams that enforce it ship fewer rendering regressions and recover faster when third parties change.
Require source diff proof that H1, intro copy, and key links exist before hydration for every indexable route type. In practice this means you should record the exact state, the date, and the sample URL before changing anything. Owners who skip this note often repeat fixes that already failed. A short log with before and after values makes the next review faster and keeps the team aligned on what was tried and what remains open.
Require server output for title, canonical, robots, and structured data with live test screenshots attached to the release note. For most small teams this step takes less than fifteen minutes per URL once the process is documented. Open the relevant report, copy the status wording exactly, and save a screenshot or export for reference. That evidence helps you compare later crawl cycles and helps developers reproduce the issue without guesswork about which template or setting caused it.
Require href audits for navigation, pagination, and related links so discovery never depends on click handlers alone. A common mistake is to treat one URL as proof for the whole site. Instead group URLs by template, section, and publish date to see whether the pattern is isolated or broad. Template level patterns point to code or configuration. Scattered patterns point to content depth, linking, or demand signals that need steady improvement across many pages.
Require status code tests for valid, missing, and parameterized routes to prevent soft 404 dilution after router changes. When you apply a fix, change one variable at a time and note the date in your site log. If you change content, links, and technical settings on the same day, you will not know which action moved the count. Clear notes also help future audits because anyone can trace why a setting exists and whether it should stay or be revised.
Require performance and error budgets for bundles and APIs with rollback triggers when render errors spike after release. Measurement matters more than activity. After the change, check the same report on the same weekday for two to three cycles and compare valid counts, excluded counts, and sample URLs. Small steady gains beat sudden spikes. If numbers stall, revisit grouping and sampling instead of repeating the same submission or request on every URL.
Key checks for a shipping checklist for javascript pages that must index fast:
- Add render diffs to definition of done for indexable routes.
- Block releases on live test failures for priority templates.
- Monitor render errors and Valid deltas for one week post release.
- Keep prerender fallback ready during router upgrades.
- Document exceptions with expiry dates, not permanent waivers.
Use this quick reference while working on a shipping checklist for javascript pages that must index fast.
| Check | What to confirm | Tool |
|---|---|---|
| Gate | Proof required | Owner |
| First HTML | Source snippet | Front end |
| Metadata | Live test | SEO plus front end |
| Links | Href crawl | SEO |
| Status | Header log | Back end |
| Perf | Bundle report | Front end plus infra |
Checklists work when they block merges. Advisory docs get skipped under deadline pressure. Wire these gates into pull request templates and deploy pipelines so proof is attached before approval. Over two quarters, the log of attached proofs becomes training material that shortens reviews while keeping indexing stability high.
FAQ
Why do JavaScript pages take longer to index than static pages?
Because content that depends on script execution often waits for a second rendering pass before it counts toward indexing. Fetch happens first, rendering queues later based on demand and resource health. Server rendered pages expose content on fetch and usually index faster. Measure fetch to Valid lag by template to quantify the penalty for your stack.
Is server side rendering required for good JavaScript SEO?
Not always, but it is the most reliable way to shorten delay for public pages with search demand. Static generation with hydration also works well for known routes. Client only rendering can index, yet it carries higher delay and failure risk. Choose server output for money templates and reserve client only patterns for private app screens.
How can I see what Googlebot sees on a JavaScript page?
Compare view source with rendered DOM for headings and body copy, then run a URL Inspection live test to see fetch, blocked resources, and indexing allowed status. Add mobile friendly and rich result tests for viewport and structured data views. Save snippets and test dates with each release for comparison. This rendered html seo check reveals googlebot javascript gaps before Valid counts fall.
Do blocked JavaScript files really prevent indexing?
They can leave rendered content blank or partial, which reads as thin. One blocked bundle or data endpoint can empty many pages on the same template. Check robots allow lists, consent gates, and CDN rules for crawler access. Allow necessary resources and retest with live rendering before editing copy.
Should we use dynamic rendering to fix delays?
Dynamic rendering can help as a temporary bridge when rewrites are not feasible, but it adds maintenance and detection complexity. Prefer server rendering or prerendering for durable results. If you use dynamic rendering, document it as temporary, monitor parity closely, and plan migration to unified server output.
What should we monitor after shipping JavaScript fixes?
Track first hit lag, fetch to Valid lag, resource error rate, and Valid trends by template for four weeks. Validate with live tests on staging and production. Watch crawl stats for increased fetching without error spikes. If lags persist, revisit bundle weight, resource access, and internal hub links before further content edits. This routine shows whether the javascript content index grows steadily and surfaces repeat js indexing problems early.